Investments

Bully for You

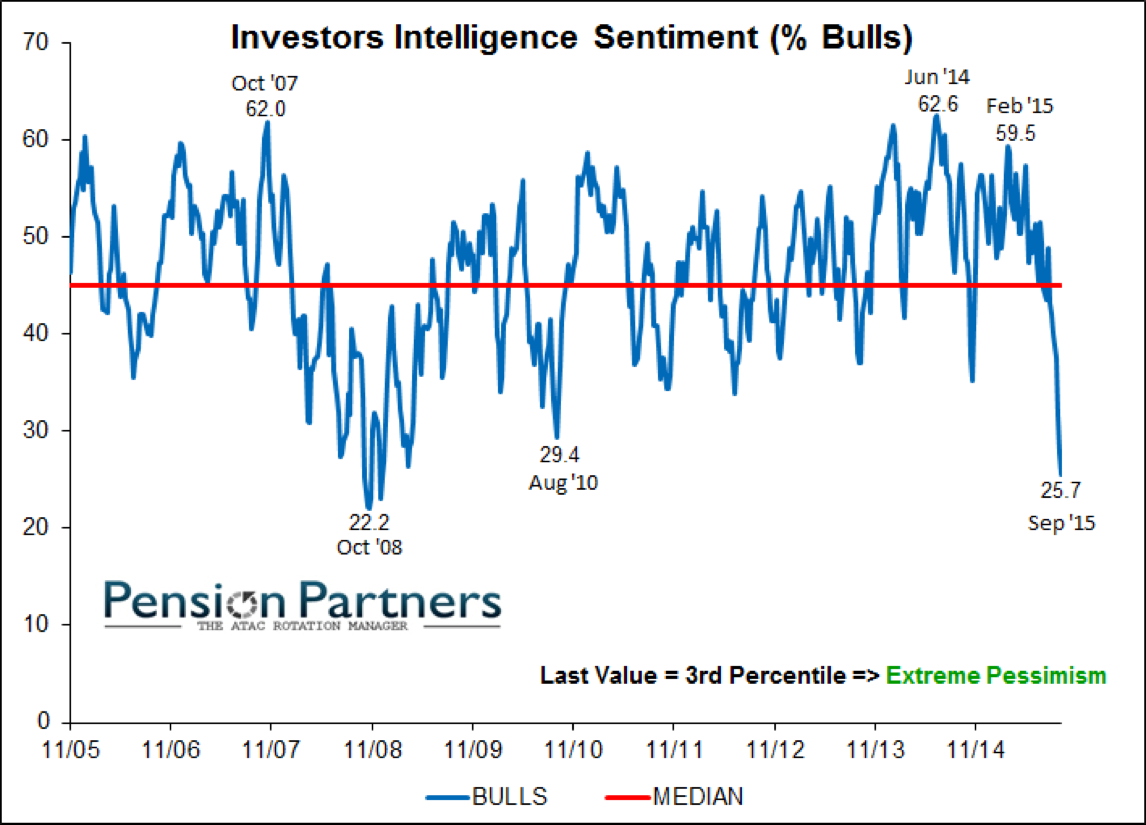
With new death crosses seemingly occurring every day, one indicator the bulls are hoping plays out is sentiment. The Investors Intelligence report this week shows we have reached the lowest bullish reading since Oct 2008.

Bay area investment advisor

As we know sentiment is a contrarian indicator and extreme readings have been good at identifying areas where the likelihood of a market reversal is high. Looking at bullish sentiment is only half the story though. To get the most accurate gauge on sentiment need to look at bearish sentiment too. As you would expect only when both are at extremes does a reversal become a high probability.

bay area financial advisor certified financial advisor cfp

Unfortunately for bulls, as you can see in the chart, bearish sentiment is currently just sitting in neutral and no where close to an extreme.  Until investors become a lot more bearish, it appears sentiment will not be much of a tailwind to higher prices.

Fill in the Blank

Throughout my 15+ year as an investment adviser I am consistently asked about “fill in the blank" with your favorite investing topic dejour.  As always, the person inquiring was watching or listening to a financial news media outlet where they were recommending investors “fill in the blank”. Inevitably when these times arise it takes everything I have not to come unglued (and sadly I must admit I have not been as successful as I wish). I become bothered not because they are asking but because they are being played, a pawn in the game and they don’t see it. Not being the most eloquent of communicators, I struggle with providing a polite response. If I only had a compelling, canned response I could help people see the error in their ways and hopefully save them some money. I recently read an article from Jason Zweig (one of the few financial media who I feel is worth listening to) that provides just that. I wanted to share some of it with you. If you can, print it out and tuck it away in your sock drawer and the next time you have the urge to turn on “fill in the blank”, pull it out and instead go do something more fun and productive such as “fill in the blank” as that will likely provide a more positive impact to your life.

If you want to learn more about Jason you can find it here or read the entire article here.

The emphasis added is mine

=======================================

I was once asked, at a journalism conference, how I defined my job. I said: My job is to write the exact same thing between 50 and 100 times a year in such a way that neither my editors nor my readers will ever think I am repeating myself. That’s because good advice rarely changes, while markets change constantly. The temptation to pander is almost irresistible. And while people need good advice, what they want is advice that sounds good.

The advice that sounds the best in the short run is always the most dangerous in the long run. Everyone wants the secret, the key, the roadmap to the primrose path that leads to El Dorado: the magical low-risk, high-return investment that can double your money in no time. Everyone wants to chase the returns of whatever has been hottest and to shun whatever has gone cold. Most financial journalism, like most of Wall Street itself, is dedicated to a basic principle of marketing: When the ducks quack, feed ‘em.

In practice, for most of the media, that requires telling people to buy Internet stocks in 1999 and early 2000; explaining, in 2005 and 2006, how to “flip” houses; in 2008 and 2009, it meant telling people to dump their stocks and even to buy “leveraged inverse” exchange-traded funds that made explosively risky bets against stocks; and ever since 2008, it has meant touting bonds and the “safety trade” like high-dividend-paying stocks and so-called minimum-volatility stocks.

It’s no wonder that, as brilliant research by the psychologist Paul Andreassen showed many years ago, people who receive frequent news updates on their investments earn lower returns than those who get no news. It’s also no wonder that the media has ignored those findings. Not many people care to admit that they spend their careers being part of the problem instead of trying to be part of the solution.

My job, as I see it, is to learn from other people’s mistakes and from my own. Above all, it means trying to save people from themselves. As the founder of security analysis, Benjamin Graham, wrote in The Intelligent Investor in 1949: “The investor’s chief problem – and even his worst enemy – is likely to be himself.”

One of the main reasons we are all our worst enemies as investors is that the financial universe is set up to deceive us.

It's What You Do

I saw this long term SP500 chart from 360virtual and thought it does a good job putting the current correction into perspective. Interestingly yesterday we hit the average annual yearly pullback of 11.5% almost exactly. It should have come as no surprise as have been talking about its eventuality for (too) months. So now what?

Bay area Certified Financial Planner Investor

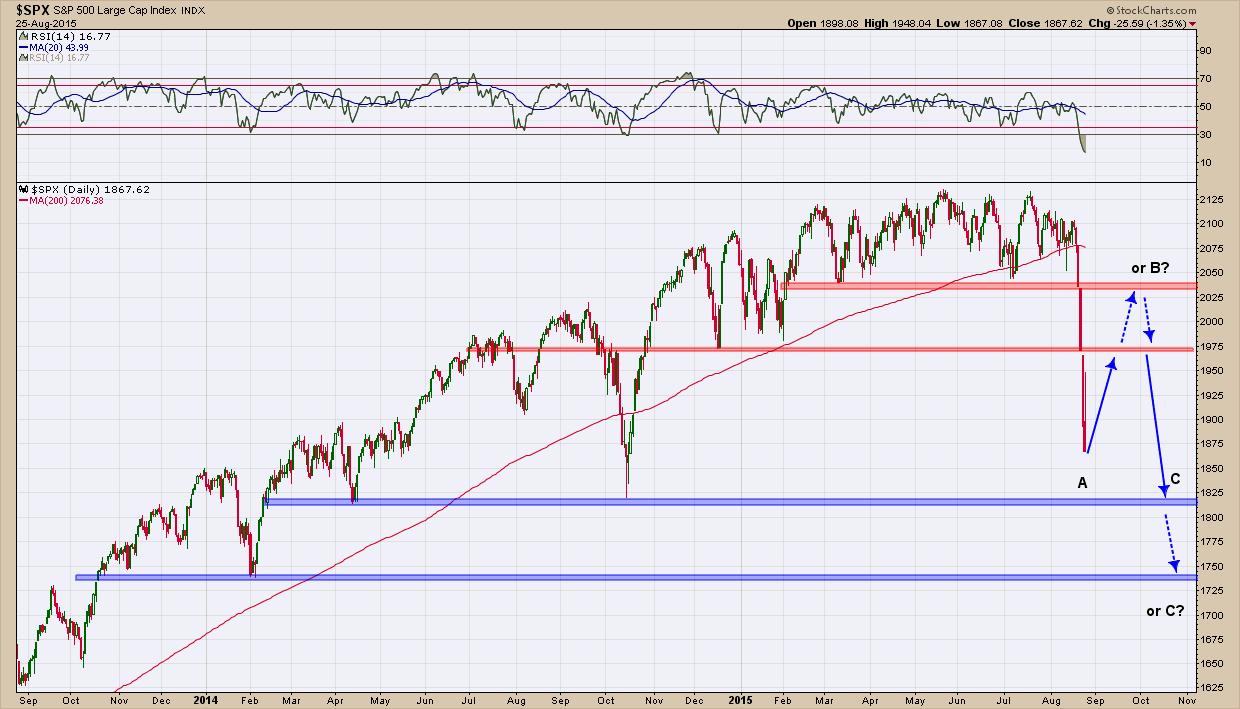
There are no guarantees on what the markets will do next but TA teaches us what is possible and I wanted to lay out what I believe is the likeliest outcome for the short-intermediate term based upon the tale of the charts.

Tuesday’s action was a very compelling tell as the markets could not hold on to their early morning gains showing that whatever was bothering the markets still is. Until this gets resolved we are going to struggle to move materially higher. A “V”-bottom like we had for the entirety of 2014 appears to be unlikely right now. As such with a weak tape and overhead resistance I see lower prices ahead.

Below is the SP500 daily chart illustrated with all the important horizontal (blue) support and resistance (red) lines. It’s important to remember those lines represent buyers (at support) and sellers (at resistance) if/when price approaches. As we know corrections are typically 3 wave (A-B-C) structures. The first wave down is A, a reflexive bounce higher is B and the final wave down is C. My view is yesterday completed wave A and are now in wave B, the oversold bounce higher. Upon completion of B we will need one more test lower to complete C.  You can see I have illustrated the chart with an ABC pattern and where likely “B” and “C” terminations will end (if this truly is an ABC correction). I expect “B” to end at or near the December 2014 lows ($1972) as this represent a previous large supply of potential sellers. A retest of the lows could find “C” zero in on the Oct. 2014 lows, $1820, an important past level of buyers.  I have also placed alternative “B” and “C” termination points (the next level of support (buyers) and resistance (sellers) levels) should the market wants to overshoot to either side.

Bay area financial advisor

As we know the markets will do what they are going to do and no one, including me knows what comes next. Trying to predict the future is a fool’s game. So one may ask why put these types of posts out for ridicule since it likely I will be wrong. The fact is what I have posted is one likely outcome and situation planning is what we do every day in our Investment Committee meetings. It’s our job to analyze the possibilities and work through the necessary action plans should they play out.  Like Geico says, “It’s what you do.”