Did you know that Portugal has had the same defined borders since 1139, making it the oldest nation-state in Europe? I didn’t either and knowing that fact is probably not going to make you money but the Portugal stock market just might if you play the chart right. After more than 3 years and an almost 50% decline in its stock market it looks as if Portugal is setting an attempt to reverse course.
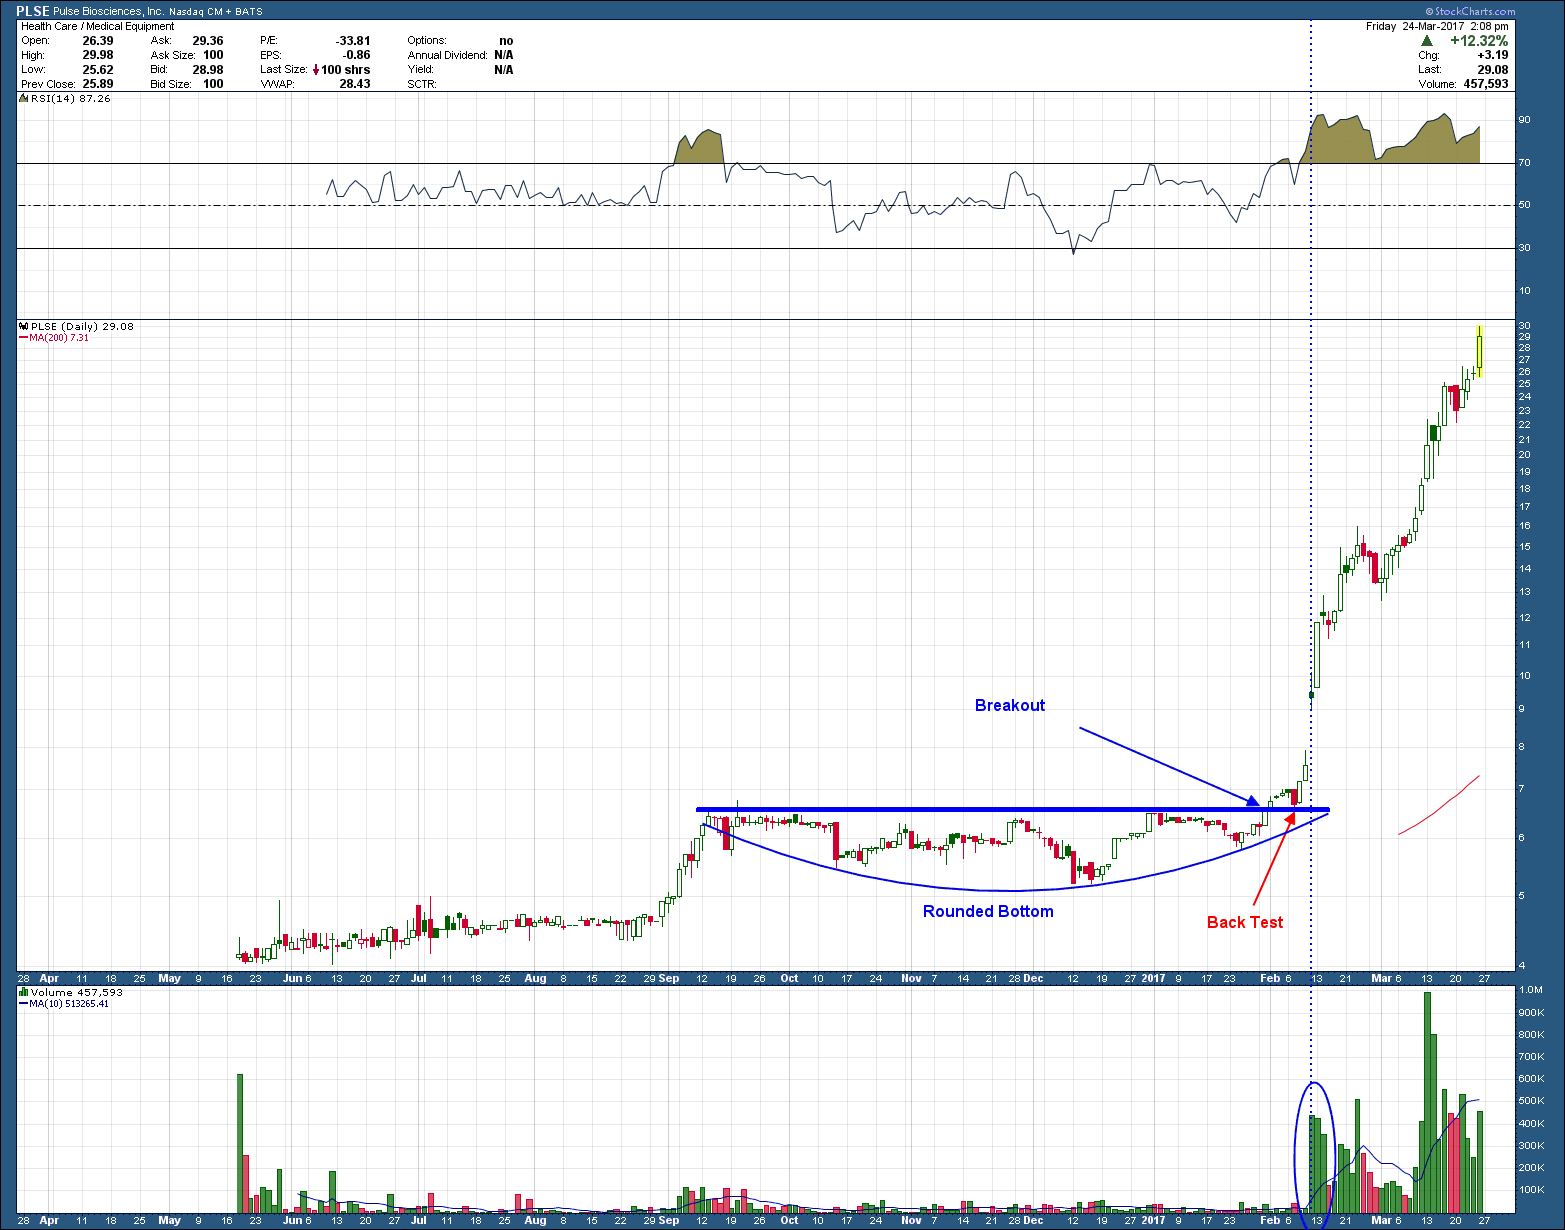
The chart is a technicians dream as it has set up perfectly for a move higher.
1. Multiple periods of positive momentum divergence have formed, the latest at its lowest price
2. Price is currently above the 200 day moving average which has flattened and just begun to have a positive slope.
3. Price has formed 2-higher highs and 1- higher low.
4. Price broke above important resistance (blue horizontal line) with conviction (big candle)
5. The breakout in 4 above was confirmed on more than 5x volume as seen in the lower pane (normally look for 30-50% increased volume as confirmation)
6. Price is breaking out of a consolidation base of 6 months or more (period under blue horizontal)
You might be wondering as attractive as this set up is why I won’t be adding it to client portfolios. Unfortunately even if we were to only take a small position (say 2%) in each client portfolio that purchase would constitute more than 50% of daily market volume, making our clients “the” market. An amount more than 5% violates our investing rules so anyone reading who is managing their own money, consider this a freebie idea. I hope you make a ton!


