Get the Door

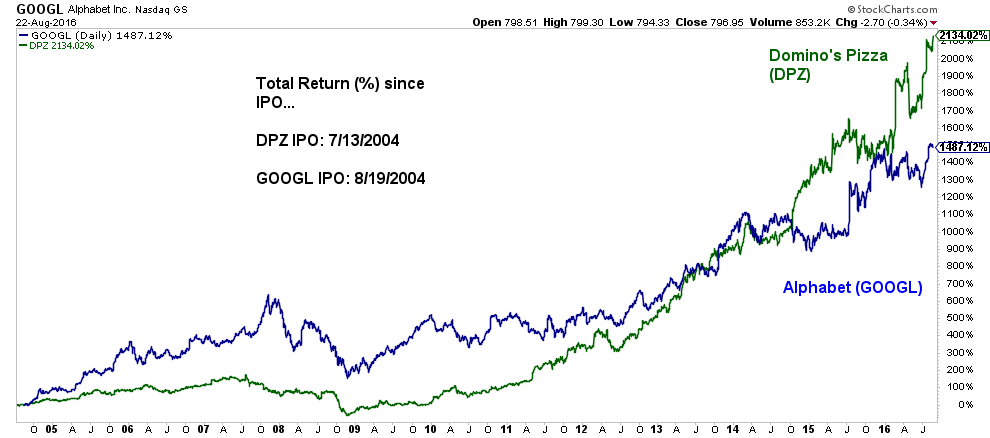
If I asked you what company had the most successful IPO since 2004 (based upon share price increase) if you are like me the first company that came to mind would be Google or maybe some other tech giant.  If so, you would be wrong like I was.

Pleasantons best bay area financial advisor, retirement planneing CFP

Who'da thunk? I guess I must be the only person in North America to have never had the pleasure of tasting #1.

Go Pound Sand

We all know the title of this post is an expression of disdain, much like what people feel when you mention the idea of the British Sterling as an investment. Recent Brexit, European economic collapse and Goldman Sachs doomsday free-fall concerns immediately scare investors away. But, looking at the weight of the evidence a contrarian might consider the charts, sentiment and how “smart money” is currently positioned as a sign in favor of a forthcoming rally in the currency.  Let’s take a look

In my first chart. a weekly look at the British Pound ETF, FXB, you can see it formed a double bottom with positive (bullish) momentum divergence. I need to point out that there is not just one but two divergences that have formed across two different time frames. These occurred after the huge, 2 consecutive week Brexit capitulatory selloff in June. This hinted most everyone who wanted to sell already had, leaving only buyers. Aiding the bullish case, last week closed with a bullish engulfing candle hinting of further upside.

Best bay area financial advisor secure certain cpf - 8022016 -FXB weekly

On the daily chart below, the divergences become more obvious as was the massive selling volume in the lower pane, well in excess of 10 times its norm.  Since the first tag of the bottom, price has formed a nice sideways consolidation channel which, if broken, should indicate the direction of the next leg of the pound’s journey. Also, while hard to see because of my small annotations, August 15 was a one day failed breakdown below the lower support line followed by a gap higher. While reasonably infrequent, when these event occur I immediately think back to one the investing adages we should never forget…” from false breaks comes big moves in the other direction”.

Bay areas best retirment planning specialist 8-22-16 FXB COT (2).png

Finally I like to look at COT (Commitment of Traders) data. Without boring you with all the details the Commodity Futures Trading Commission (CFTC) releases a COT Report which aggregates all the futures positions of every major player in the futures markets. The data is broken down into three sections and what is important to investors is how the “Commercial” traders are positioned. You see these are the whales, the guys with the big bucks and while not always right I have learned the hard way you DON’T want to be positioned (for very long) on the opposite side of them. In the chart below for the British pound, the pane is the price movement of the pound, the second pane is the commercial trader’ position, the third pane is the large trader and the last is the small speculator. While the chart includes only 5 years worth of data, I went back through more than 25-years and this is THE largest long position in the British pound. EVER!  The smart money is positioned for a rally in the pound. How about you?

Bay areas best retirment planning specialist 8-22-16 FXB COT (1)

I know there are doubters as I can be included on that list. But as investors some of the best returns are those which no one expects which is why we need to remove all biases and keep our minds open to all opportunities. The weight of the evidence strongly suggests a powerful rally in the British pound is likely in our future.  The downside risk is limited as an exit below the failed breakout low makes for a compelling risk to reward ratio on this opportunity

You Can Observe a lot by Just Watching

Normally I post investment opportunities after-the-fact as those charts tend to hold a lot more information and are much better learning tools. Everything else up to that point of confirmation is just a “potential” opportunity that holds some level of interest. My level of interest grows or falls depending upon a number of factors, one of the highest being the development of high probability patterns. 

So it goes with today’s post, oil has formed an almost perfect bullish inverse head and shoulders reversal pattern from an oversold divergent low. There are, of course, no guarantees but my experience is this setup has produced some of the biggest returns. The first of its two targets is just above at the 60 area and if that level is breached, I see a potential retest of the 75-77 area. Notice how the (red) 200 day moving average contained price on the way down and how it is now acting as support on the way up.  This is symmetry in action. Price bounced right off the moving average on its first pullback after gapping above it in April. RSI momentum is rising and has a lot more room to the upside if price wants to push higher. An investor couldn’t ask for a better setup. And yet I am hugely skeptical and a non-believer.

retirement planning investment managment advisor best in bay area - 8-17-16- oil

This is not because a confirmation break above the blue horizontal neckline has yet to occur but rather because oil’s fundamentals, quite simply, suck! Too much supply, stagnating demand and world economies that have flat-lined (at best). This is NOT the sort of backdrop that we want to see if we are betting on higher oil prices.   So I should pass on the investment, right?

This is a great example of a bias. Everyone has them, even those who are not supposed to, including me. Based upon the fundamental backdrop, I have formed a belief (justified or not) that oil prices can’t move higher. The fact is anything can happen and if I pass on this investment I am committing to make one of the cardinal sins of successful investing. This is exactly how retail investors act and why they consistently under-perform the market.  A better approach might be to take the investment opportunity (once confirmed) but manage your risk (biases) by reducing position size. Instead of committing say 5% of your investment capital, reduce it to say ½ or 2/3rds of normal. You never know this single investment could be the difference between this year’s portfolio performance being a winner or loser. My mentors, some of the most successful market traders/investors all agree in that typically in any given year just 10-20% of their investment ideas make up 90% of their annual gains. The rest are either no impact or turn out to be losers. This is why a good investor cannot let their biases enter into their investing process.

In case I have done a poor job, this post is not really about oil and the potential big move to the upside (well, maybe just a little) but rather about accepting our natural human biases/beliefs and managing the biggest obstacle to investment success, that person in the mirror. To take liberty on one of my favorite Yogi-isms …. Investing is 50% process and the other 90% is mental.    

As an aside, as I get ready to submit this post, oil inventory data is being released in a couple of hours which can move the price oil dramatically in both directions. So it’s a good time to remind everyone that news always trumps the charts. ALWAYS

Gold – Is it Time for a Breather?

The rally off the January bottom has been exciting for the precious metals bulls (if there are any left) as it has climbed some 30% and confirmed its uptrend forming a series of higher highs and higher lows.  Combine that with price being above a rising 200 day moving average and momentum in the bullish zone.

Some may be asking why the reference to a breather?  While I don’t put an excess amount of validity into rising or falling trend lines when they come together in a confluence with other indicators, they I find them compelling. In this case gold is running into resistance provided by the falling (red) trend line right at the same time important overhead, horizontal resistance is coming into play.  Using the weight of evidence approach, this area is warning we should expect a consolidation at best or pullback at worst.

There is nothing for the bulls to be concerned with here (yet) as we are in a strong uptrend but to take a breather and unwind some of its newly formed overbought condition and refuel for the next leg up. Looking to the left this area has the potential to bring a very large amount of (“I want to get out of this position so I can break even”) sellers so it would not surprise me to the price of gold chop around for weeks and maybe months. On the flip side of that investments that are trending strongly have shown the ability to slice right through resistance zones so what it actually does will only be known in hindsight. In the meantime, and to set the expectation of potential upcoming weakness, gold bulls need to take a chill pill. Because once this is over and price moves above both resistance levels, it should be smooth sailing until $1580.

Best bay area independent financial advisor fiduciary retirement planner