I like to follow the All-Country World Stock Index, ACWI, as it is a great way to measure global investor’s risk appetite around the world. If the index is rising, its a clear sign global investors are "all in" on stocks. As an investor living in the US, we have a tendency to focus our attention only on those investments in our own backyard and lose sight of the rest of the world. While that strategy has paid off over the past few years (mainly due to the rising dollar) it wont always be that way so its important to keep a close eye on what's happening across the globe. .
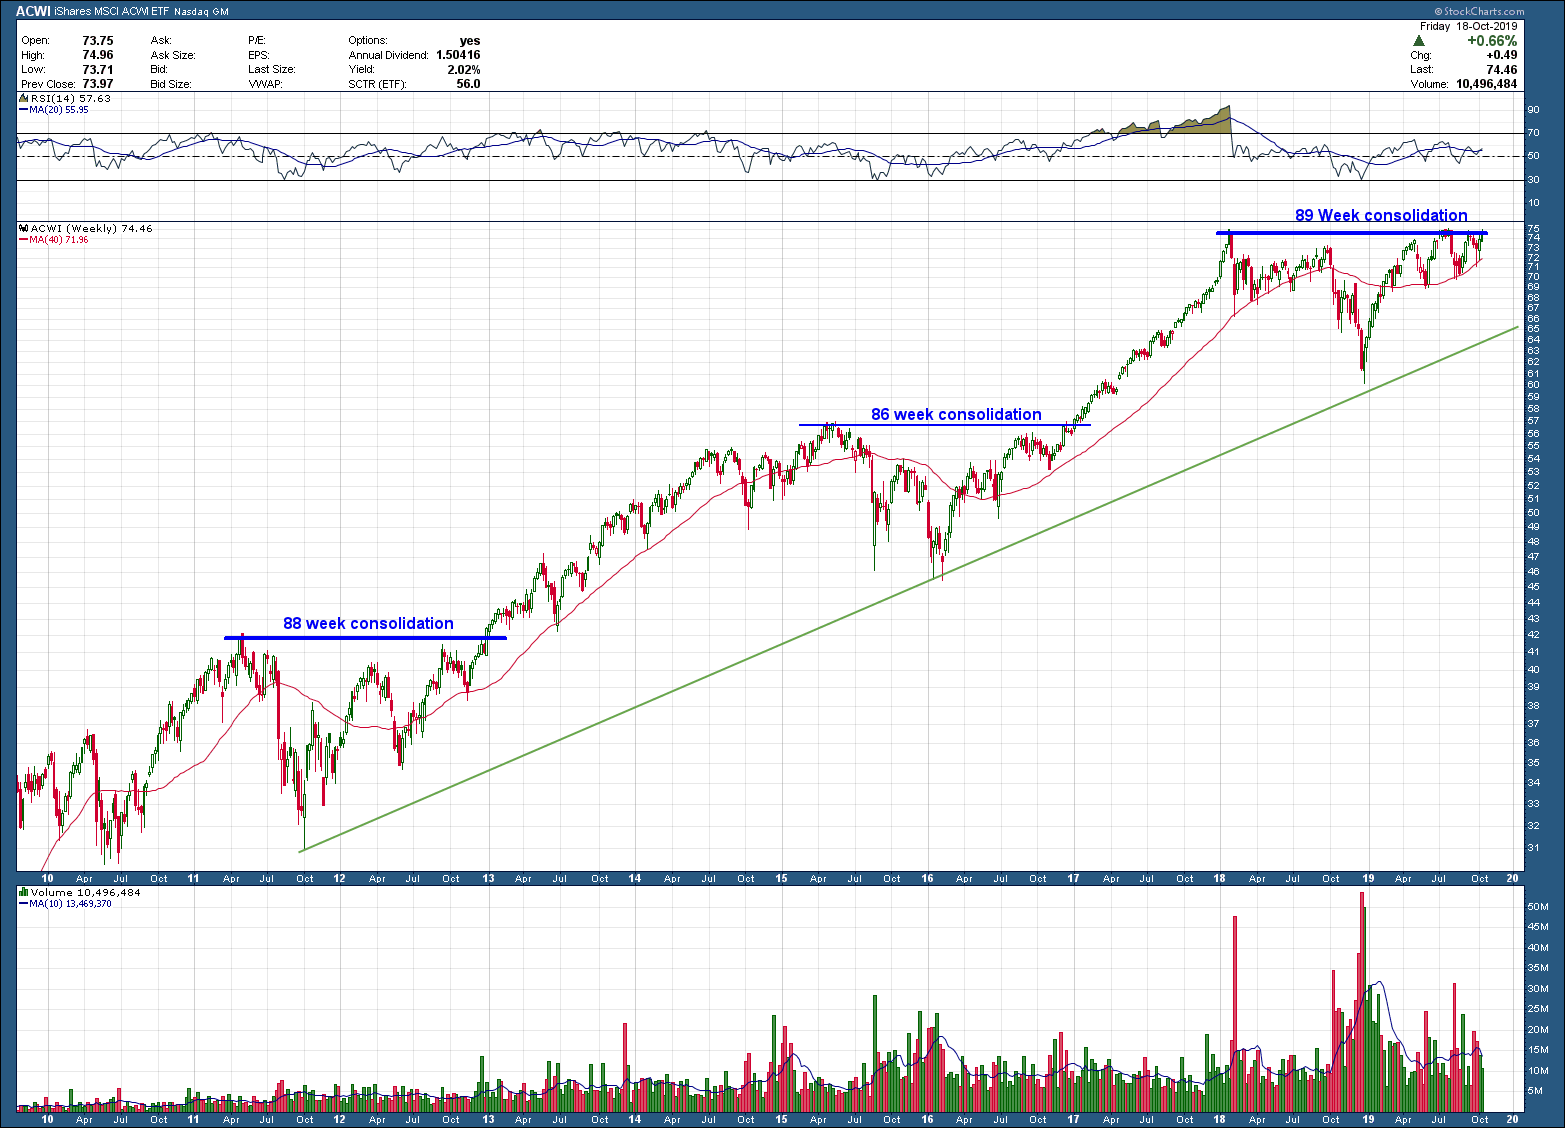
In the ACWI chart below, the index sits just a percent or two away from all time-highs, telling us its not just US stocks that are doing well. In addition, its price sits above its rising 200-day moving average, is sporting a bullish cup and handle bullish pattern (that is not yet confirmed) and in its 89th week of consolidation. Notice how, since the 2009 bottom, the index has done the same thing twice before, consolidating 86 and 88 weeks before breaking out to its next leg higher, both exceeding runs of 30%.
This is an excellent example of not only patterns repeating but symmetry too. If we believe this is not the end of this bull run, the next move would be for the index to breakout to new, all-time highs and from a timing standpoint, it would expect that should occur in the not too distant future.
