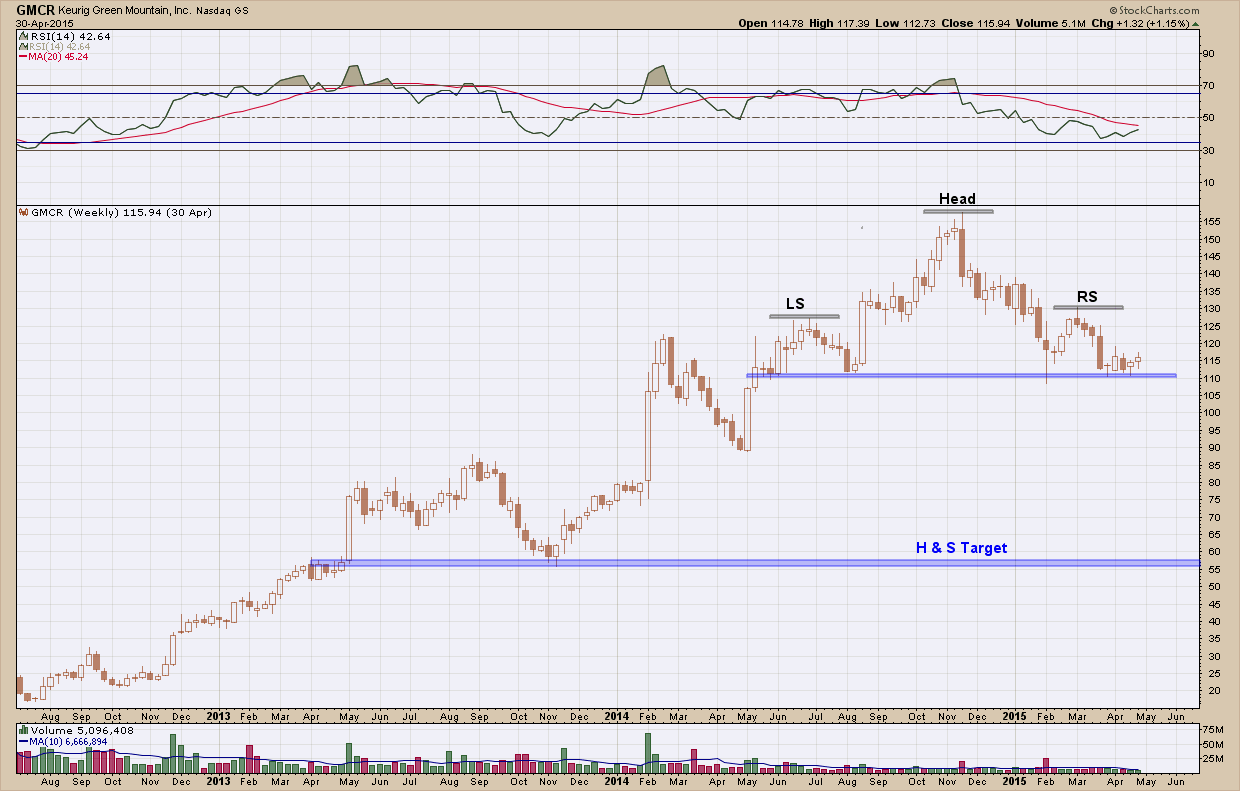
In case the name doesn’t ring the bell, Green Mountain Coffee Roasters (GMCR) manufactures the Keurig brand of coffee makers. Its stock was a darling of Wall St. rising more than 900% in 2 ½ years, topping out in October of last year as you can see in the chart below. GMCR was consistently on every analysts buy list and made savvy investors a ton of money during the stock’s ascent. After topping, the stock began to fall and formed a text book, beautifully symmetric, head and shoulders reversal pattern. At the time, I personally bailed out of the stock and warned investors to sell because of the pattern target (highlighted and labeled with the blue horizontal line) downside was indicating the potential for a huge loss. I remember thinking at the time the decline, the potential for a 50% hair cut seemed completely unrealistic. This seemed especially true when considering the backdrop of it being such a strong company producing excellent results, loved by institutional investors and the overall market was still very bullish. As you would expect, as they are typically late to the party, and in spite of the technical warnings, analysts continued to push the stock.
One of the benefits of my training as a market technicians is I learned to not spit into the wind, tug on Superman’s cape, pull the mask off the Lone Ranger and most importantly not short a Wall St. darling stock in a bull market. As such I did not, in spite of it being perfect setup. I was too chicken.
Fast forwarding to today let’s check in to see what has transpired over the past 2 months since forming the right shoulder of the head and shoulders pattern. In the chart below you can see we have fallen almost 40% from the neckline of the pattern and it does not appear we are done. You can see in the upper pane, which shows momentum, we are so deeply oversold (it has never been this oversold in its history) that I expect to see a bounce higher over the next few weeks as it needs to unwind this condition. Once the unwinding is complete I expect the stock to follow a similar path to what I have illustrated on the right hand side of the chart by bouncing higher and then ultimately finishing its decline down to the pattern target around the 56-58 level. Where it goes from there is anybody’s guess and we will just have to wait and see what develops between now and then. The bottom line is those that were brave enough to take the short are now up 40% in 2 months. I don’t need to remind anyone that is more than a 200% annual return.
Clearly, those who were bold enough to hold the position the entire way up and then short the breakdown have profited immensely. There are two things readers should take from this analysis 1) trend followers can make money in both up and down markets (if they aren’t chicken) and 2) every stock (even those who are revered by the Wall St pundits) have their days, weeks and months in the dog house – as such don’t fall in love with your investments.
Now that I have proven to myself making money shorting a Wall St darling is possible can anyone tell me where I can find Superman or The Lone Ranger?

