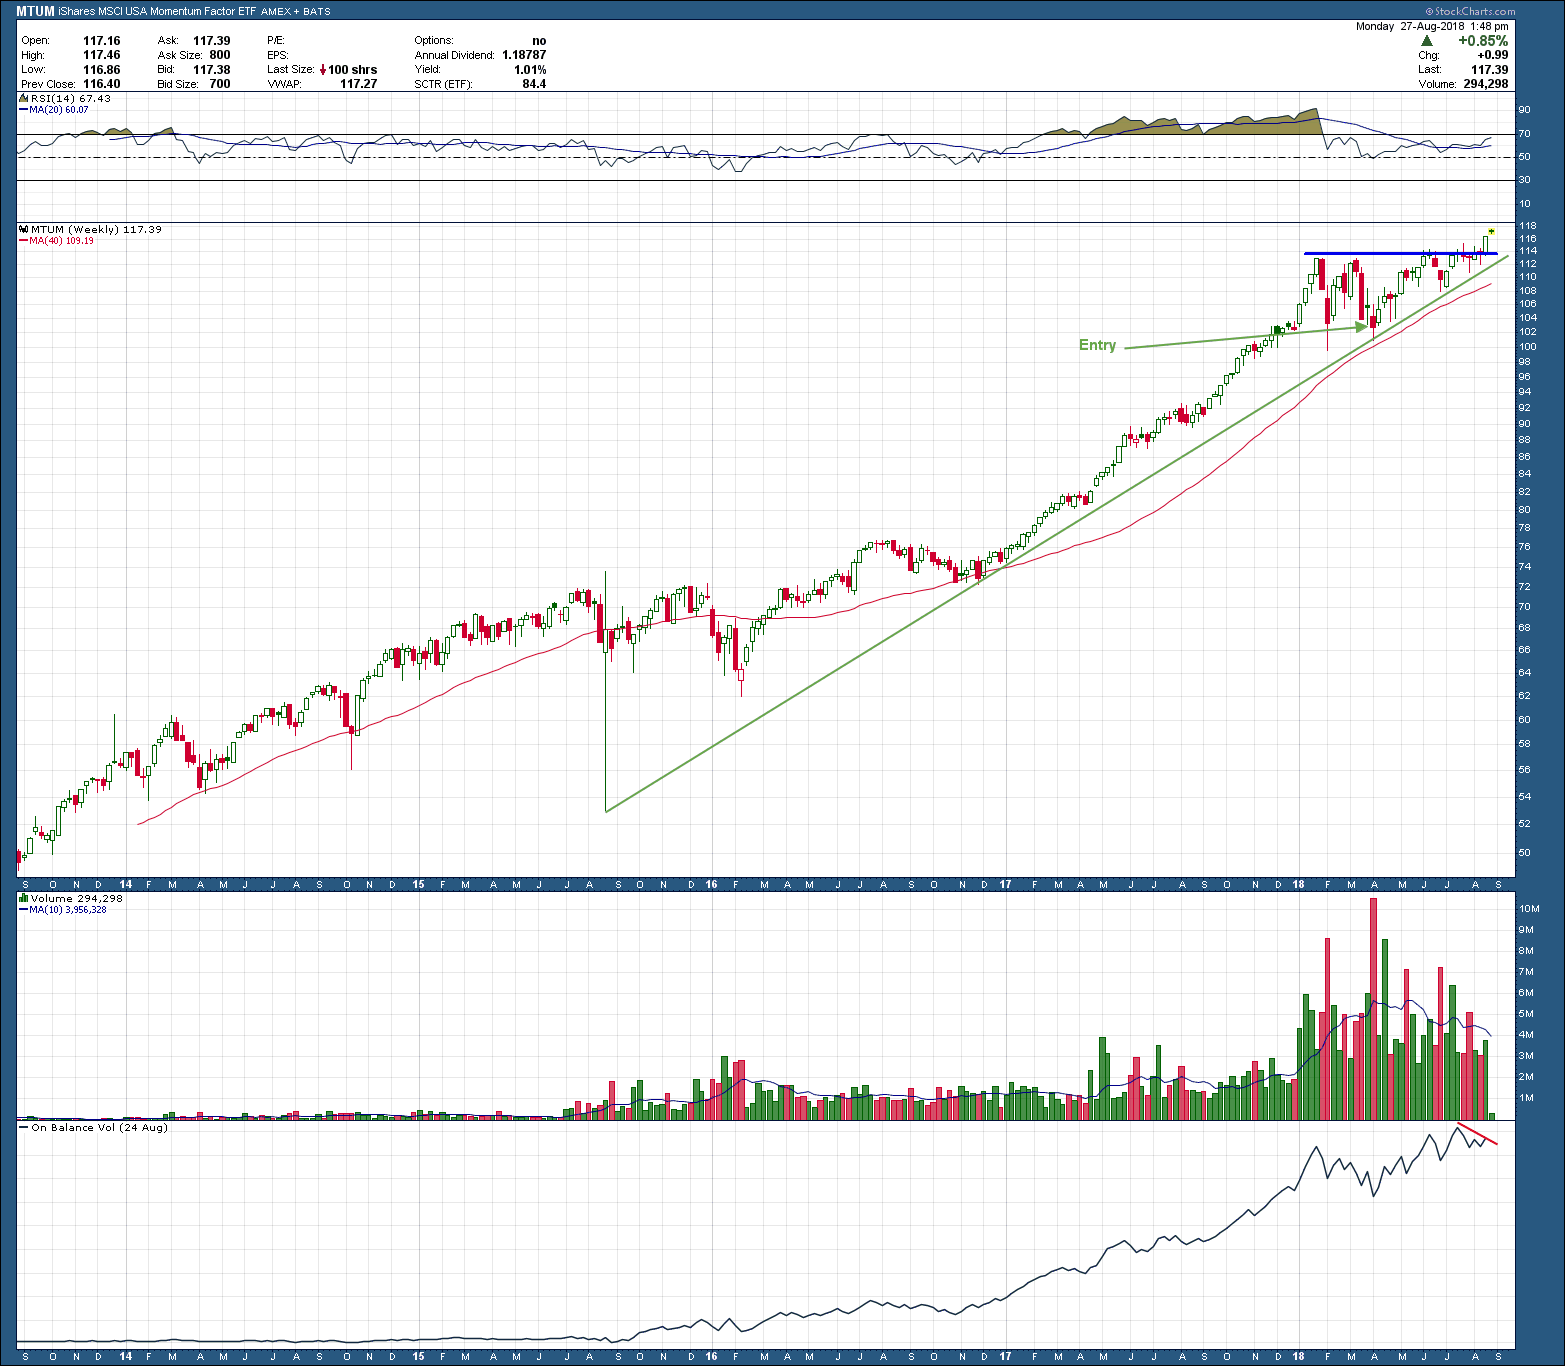
I have written about the numerous studies showing the case for momentum stocks being a core holding in your portfolio here in the blog. If you don’t know how to screen for momentum stocks or prefer not to mess with buying individual shares, there is an ETF from Ishares, MTUM. It seeks to track the performance of an index that measures the performance of U.S. large- and mid-capitalization stocks exhibiting relatively higher momentum characteristics, before fees and expenses of course. Easy-Peasy
As you can see in the chart below, it recently began trading with enough volume for us to consider adding as a core position to client’s portfolios. I do think our entry in April was excellent as it created a wonderful pullback buying opportunity. As you can see during the consolidation that started in January, RSI momentum unwound out of overbought territory and was set up for its next push higher. And higher we go as price broke out to new, all-time highs last week. All that is great news for MTUM holders but I just noticed the Referee pulled out the yellow caution flag. Notice how at the same time while price was making all-time highs, on balance volume (lower pane) was making a lower high. It’s not time to throw in the towel just yet as divergence can easily be wiped out and be nothing but memory roadkill if we see an increase in the number of buyers in the coming weeks. So, the bottom line is it’s not a problem …. until it is.
I know some of you are thinking what good is this technical analysis stuff. Every time I show a chart it’s never 100% clear or certain as there is always something both good and bad. Which is exactly why you 1) use a weight of the evidence approach to making an investment decision and 2) have an exit plan in case the market proves you wrong. TA is not about being right but instead about managing your risk.
