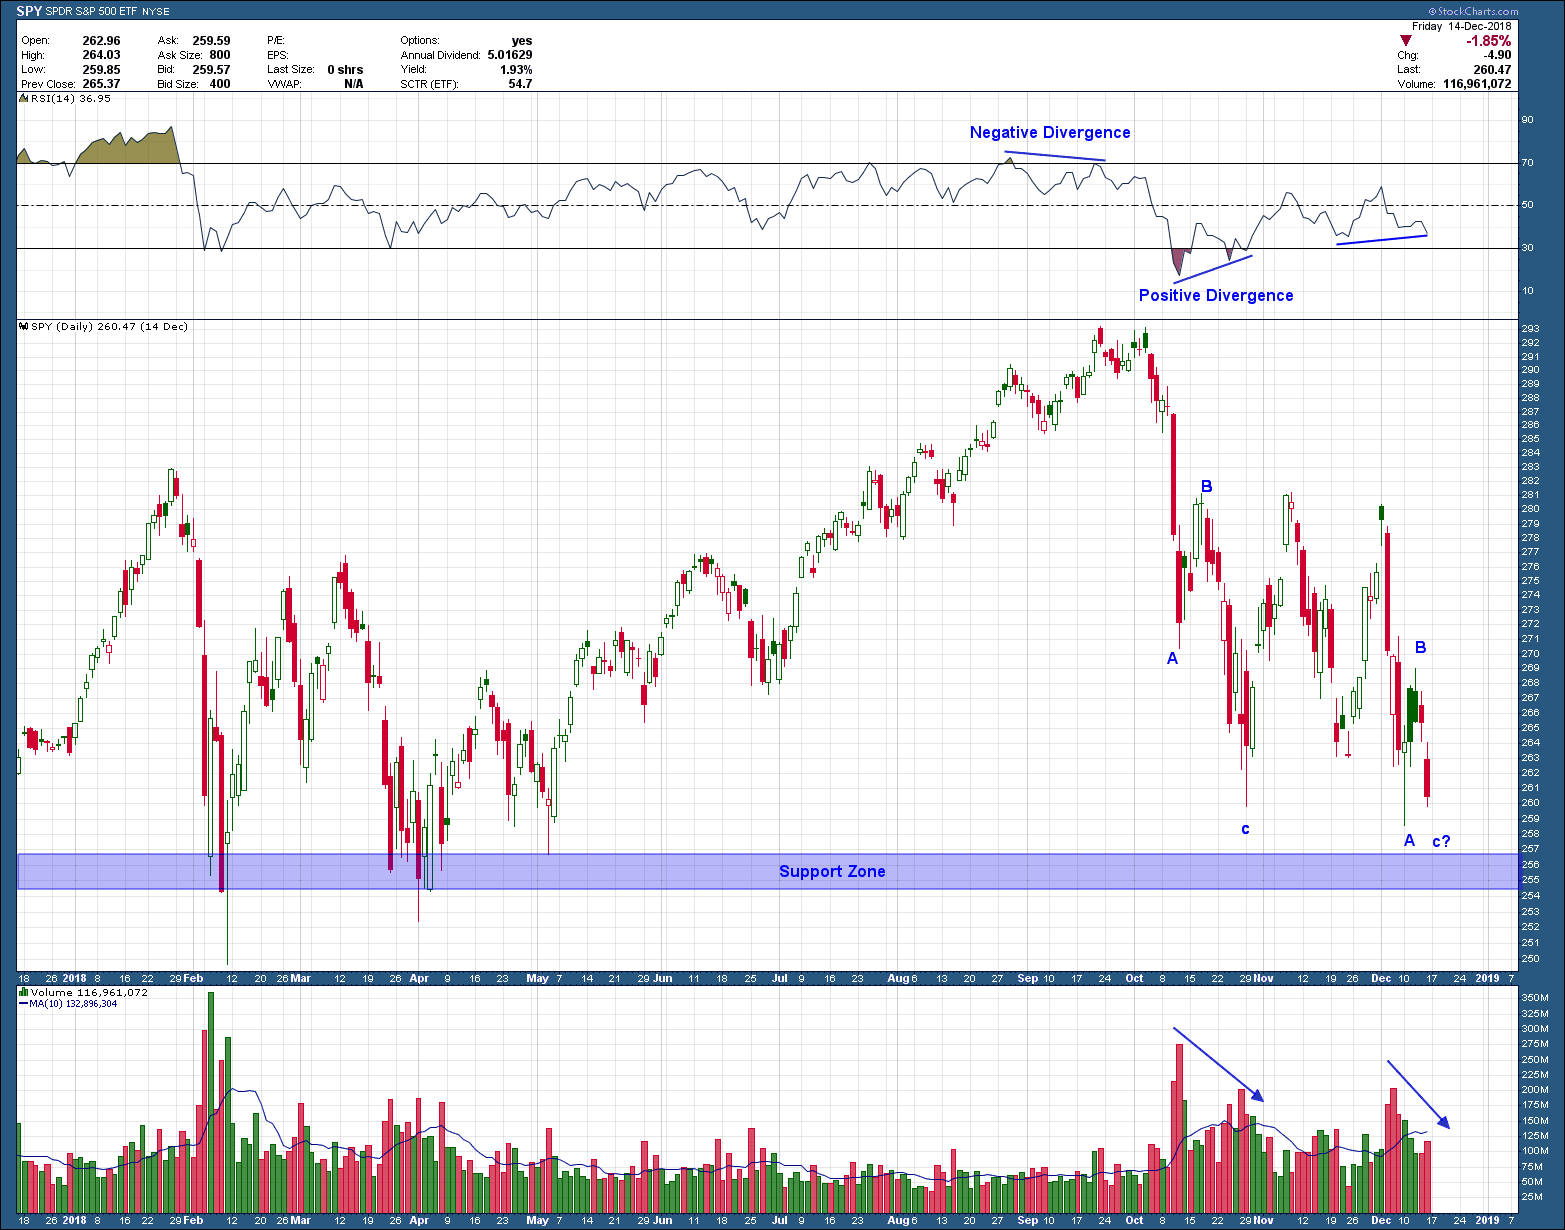
I am sure you don’t need my confirmation to know the markets have a bug up their rear. Since peaking in October, the SP500 has declined almost 12% peak to trough and sits just above the February lows. That low should act as support if prices want to probe lower. Notice how the initial breakdown from the Oct high was a 3 wave (a-b-c) decline on falling volume? Also, how the current push down is set up to be exactly the same? We just don’t know where wave c will end on this push. If symmetry is any gauge, a logical target for c to complete is around the “support zone”.
Because the market moves in waves (its internal structure), we know a reflexive bounce is likely due soon (this coming week?). Short term traders will take this opportunity to add risk while longer term investors will need to see where this next bounce higher ends. A failure to break above the initial b wave high, would be the time to consider exiting all stock positions by selling into strength. A move higher would target October’s (and all-time) highs as the next logical area for a move higher to stall.
Most large downward moves are in response to either news or poor investor sentiment, or both. Which is why, I am going to stand behind my 10-21-18 video of why I believe October’s highs will turn out to be the end of this almost 10-year bull market. I hope I am wrong.
