Yield

$8 Trillion

Global bond yielding less than zero (yes, that means lenders are paying the Government to let them hold their paper) now exceed 8 Trillion dollars. In total, there are 18 countries with negative bond yields ... in the 10th year of one of the largest global economic expansions no less.

San Ramon CFP  investment advisor 4-15-19.png

Central banks only tool left in their toolbox in an attempt to counter slow or negative growth is to stimulate the economy by lowering interest rates. At some point all that want to borrow have done so and keeping rates so low harm only those who require bond income (retirees). With this going on since the 2008-09 crash and not having the desired effect one has to wonder why continue and then immediately brings to mind this quote

The definition of insanity is doing the same thing over and over again, but expecting different results – Albert Einstein

You need to look no further than the chart above to the reason why I am a firm believer Europe is winning the race …… to the bottom and the next economic crisis will begin from that region of the world.

Q1 2019 Charts on the Move Video

Impressive moves from Christmas eve lows have the worlds stock markets very extended.. Typcially, prior highs act as formidable resistance, will they again? Or, will this be the mother of all rallies that ignore those levels and slice right through? Something to ponder as you listen to my most recent charts on the move video.

https://youtu.be/jZ_m4tYgOAk

Inversion Update

In June of last year, I wrote about how the US treasury yield curve was getting close to inverting and how that has historically been an accurate predictor of future recessions. Why it matters to investors is because a recession usually brings falling stock, commodity and asset prices (not all, but most risk assets), something we would prefer to avoid (as much as possible of). Obviously any prewarning we could get would be a bonus and allow to prepare for a high probability slide in risk asset prices. As history has shown, a yield curve inversion tends to precede recessions, unfortunately it doesn’t happen immediately nor consistently, varying from a period from 6 months to two years after the curve flips negative that the recession hits. At the same time yields invert, the stock market tends to continue its climb higher from the day of the inversion until it eventually hits its cycle peak. The timing of that stock market peak varies widely. All we know is stocks eventually peak and then fall. So, in summary, investors will get an early warning of a recession but won’t actually fall into a recession (if at all) until some point in the future which we, of course don’t know when it will occur. Add to that fact we won’t find out we are in a recession until after the fact and even if we do, the stock market won’t care …. until it does. Do I have that right? Ok, so much for the part about being prepared.

The reason I am resurrecting this topic is because, for a brief instance during last Friday’s session, the yield curve flipped negative. The good news, it closed 3 cents above the inversion level, the bad news, in my opinion, it is just delaying the inevitable. All facetiousness aside, investors would be wise to keep a close eye on the yield curve going forward. An actual inverted close and hold would be a time that investors should consider lightening up on risk asset exposure (that is unless the potential for a large drawdown is acceptable and you have time to make it back) and/or make sure you have an exit plan.

San ramon certified financial planner and fee only investment advisor - yield curve - 3-25-19.png

The good news is historically there has been ample time to make preparations if investors wanted to do so once the curve inverts. The bad news is, no one rings a bell and sometimes you take an early exit. I need to reiterate as of now we do NOT have an inverted yield curve so I may be nothing more than the boy crying wolf. But when you add this potential to the fact we are into the longest expansion without a recession ever in history, feel free to ignore the warning signs at your own risk.

Bonds Away

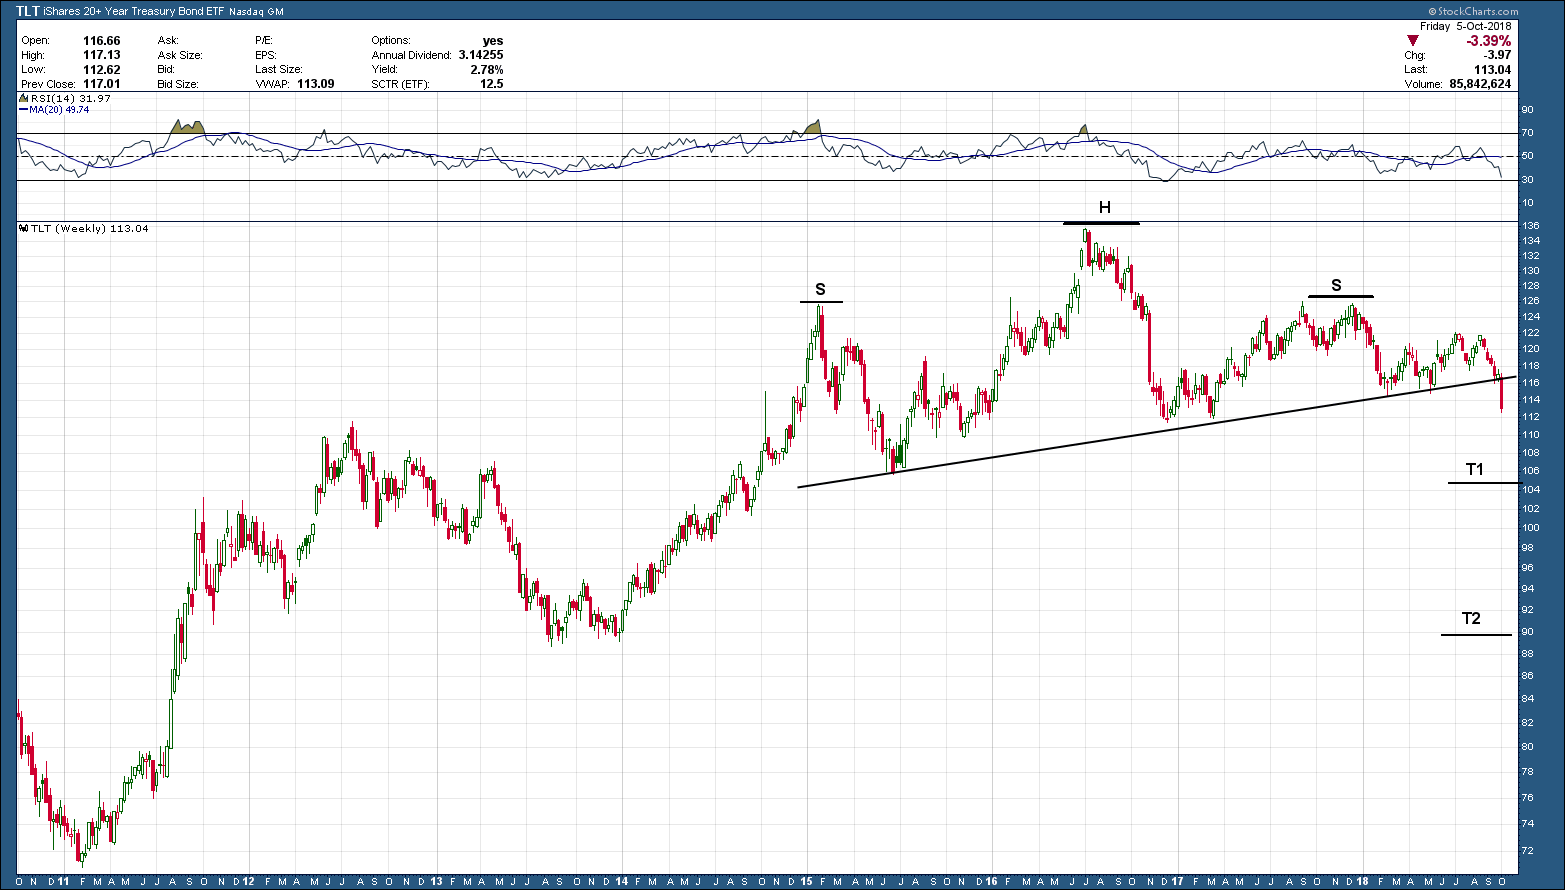
The most important development of the week (and maybe the year) took place in the bond markets. As such, it should come as no surprise that last week’s volatility in stocks was directly related to what was happening to bonds. As we see below in the chart of the 20-year bond ETF, TLT, it started the week right on the neckline (support) of the multi-year head and shoulders topping pattern. As the week progressed, the sell-off in bonds gained steam and eventually closed out firmly below support. Investors under 40 years of age, and possibly even 50 or older (depending upon when they started investing) have never experienced a declining bond market. So, for most a potential bond bear market is uncharted territory.

san ramon napfa fee only financial advisor CFP.png

As you know by now, all patterns are not relevant or meaningful until they have a confirmed close. A confirmed close we have but we need to see the neckline hold as resistance in the coming trading sessions. If so, the 20-year bond has a tough row ahead as the first target is down at T1, and the second is back at 2013’s lows, some 20% below where we started the week.

The table below shows an example of what bond holders across different types of bonds could expect with only a 1% rise in rates and why this potential breakdown is such a big deal. Not every rising rate period is exactly the same so your mileage may vary. What stays constant regardless of the period is the fact the longer the maturity, the greater the expected decline.

bay area napfa fee only financial advisor CFP.png

September 2018 Charts on the Move Video

The bulls were out in force as we closed out the third quarter. With the expected year end rally, 2018 looks to be another strong year for the market…. the US stock market. Bonds, commodities and foreign investments continue to under-perform and act as an anchor to portfolios. Mean reversion will eventually show up but, based upon the charts, Q42018 seems like more of the same.

My Q3 recap video can be viewed in the link below.

https://youtu.be/MgUbcV8Ckb8