Bull Market
noun \ˈbu̇l ˈmär-kət\
Random market movements causing investors to mistake themselves as financial geniuses.
In spite of my continual poking fun at anyone putting too much confidence into fundamental only analysis, I do fully admit they should be a part of an investment process. My problem with them is that they really only become obvious when looking in the rear-view mirror. They are horrible for making decisions on timing because once the information is known, the market has already reacted and it’s too late. In spite of that, I do find them useful and include them in my investment process as one element among many. They are of similar value that longer-term charts are. Directions and trends are more easily discernible and so they help to make short term decisions better but only when used with a weight-of-the-evidence approach.
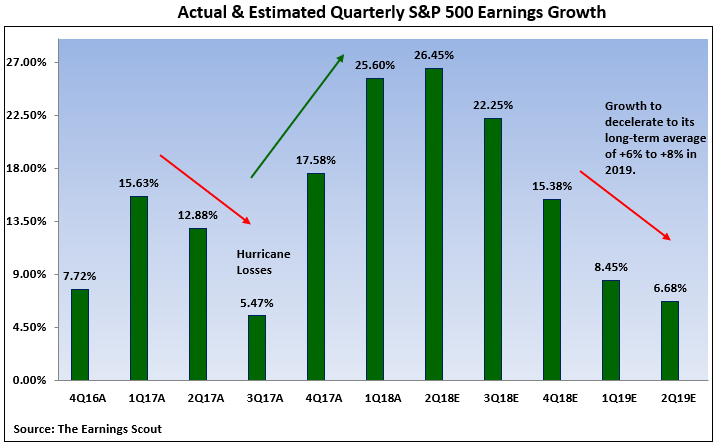
From a fundamental standpoint we know that, in theory, stock prices are directly correlated to corporate earnings growth. Stock prices move higher along with earnings and vice versa, Below is a chart of a 6 quarter look-back and 4 quarter look-ahead of the SP500 indexes earnings growth.
For the sake of argument if we take the estimated data at face value (don’t get me started on estimations and the ability to predict the future), the chart is telling us we will see a peak in earnings this quarter (Trump tax and policy changes) followed by a significant rollback to the long-term average. While I do believe the future growth numbers provided will be wrong, I am certain earnings will mean revert lower. Bottom line is the chart is telling an accurate tale. The when, how fast and how much will only be known in the future though. What equity investors need to determine is what impact will earnings mean reversion have on stock prices in the future knowing their strong correlation?
