Commodities

It's Coming, Are You Ready?

Automation may wipe out 1/3 of America’s workforce

In a new study that is optimistic about automation yet stark in its appraisal of the challenge ahead, McKinsey says massive government intervention will be required to hold societies together against the ravages of labor disruption over the next 13 years. Up to 800 million people—including a third of the work force in the U.S. and Germany—will be made jobless by 2030, the study says.

The bottom line: The economy of most countries will eventually replace the lost jobs, the study says, but many of the unemployed will need considerable help to shift to new work, and salaries could continue to flatline. "It's a Marshall Plan size of task," Michael Chui, lead author of the McKinsey report.

In the eight-month study, the McKinsey Global Institute, the firm's think tank, found that almost half of those thrown out of work—375 million people, comprising 14% of the global work force—will have to find entirely new occupations, since their old one will either no longer exist or need far fewer workers. Chinese will have the highest such absolute numbers—100 million people changing occupations, or 12% of the country's 2030 work force.

The details:

  • Up to 30% of the hours worked globally may be automated by 2030.
  • The transition compares to the U.S. shift from a largely agricultural to an industrial-services economy in the early 1900s forward. But this time, it's not young people leaving farms, but mid-career workers who need new skills. "There are few precedents in which societies have successfully retrained such large numbers of people," the report says, and that is the key question: how do you retrain people in their 30s, 40s and 50s for entirely new professions?
  • Just as they are now, wages may still not be sufficient for a middle-class standard of living. But "a healthy consumer class is essential for both economic growth and social stability," the report says. The U.S. should therefore consider income supplement programs, to establish a bottom-line standard of living.
  • Whether the transition to a far more automated society goes smoothly rests almost entirely "on the choices we make," Chui said. For example, wages can be exacerbated or improved. Chui recommended "more investment in infrastructure, and that those workers be paid a middle wage."
  • Do not attempt to slow the rollout of AI and robotization, the report urged, but instead accelerate it, because a slowdown "would curtail the contributions that these technologies make to business dynamism and economic growth."

For Gold Bulls the Disappointment Continues

As you can see in the ratio chart (middle pane) below that gold’s out-performance against the SP500 came to an end in 2012 when the ratio broke both the upper red horizontal and blue uptrend line simultaneously. Since that time the SP500 has been kicking tail as it has outperformed gold by ~45%.  We can also see that the ratio has been consolidating sideways since 2015, bouncing between the upper and lower channel providing gold bulls hope a turnaround was in the cards.  Unfortunately, it was not to be as you can see support finally gave way to the down side last month.  

Ratio charts are a great way to view relative performance but ultimately help decide which to commit your investment capital to (assuming achieving the best returns are what you desire). In the choice between gold or stocks, the chart is sending a strong message that stocks are the place to be. Like all trends this will eventually change, but until then there is no reason at this time to be (over)exposed to gold.

san ramons best cfp retirement planning fiduciary investment advisor - gold bulls 12-11-17.png

Ensco

The third attempt and failure by ESV to breakout in the first quarter of this year marked “the top” as the stock went on to fall more than 65%, peak to trough. With its fortunes tied to the price of crude, as an oil services company it was no wonder its price was hammered. With the price of oil now stabilizing between $50-$60/bbl, it would seem ESV shares may have a chance to move higher and allow investors a path to profits.

San Ramons best certified financial planning retirement planner, CFP and investment advisor 11-13-17 - ESV.png

Steep sell-offs can sometimes create very profitable money making opportunities. The problem is sell-offs, especially as sharp as this has been, are rarely done to healthy and viable companies. In other words, there is a reason the price just fell off a cliff and unless you know what you are doing, it’s best not to try and catch a falling knife. But if one were so inclined and because any investment at these levels would be considered going against the current trend (on my timeframe), minimization of risk via tight stops and smaller position size would be a prudent consideration. After forming positive RSI momentum divergence at the same time finding a bottom in August, price has formed a higher high and higher low, the first step required for a reversal.  Additionally, an inverse head and shoulders reversal pattern with an upward sloping neckline has formed. With price currently sitting just below the neckline, a break and hold above it would signal the pattern is in play and points to a pattern target at April’s high, T1.

By no means is ESV a perfect setup. Price still is below a falling 200 day moving average and as such any move higher will likely be met with choppy action. In addition, its stock price is directly tied to the price of oil, which adds additional layers of risk and highly subject to the vagaries of geopolitics, something I would prefer to avoid.

October 2017 Charts on the Move Video

The markets look tired and even though we are continuously making fractional new highs, there is a clear lack of broad based participation. Instead we are seeing sector rotation. In spite of that, seasonality patterns still are a tailwind for risk assets through the balance of the year.

My latest Charts on the Move video can be viewed at the link below

https://youtu.be/w1_pn1SpM8Q

Is a Pending Dollar Boom Ahead?

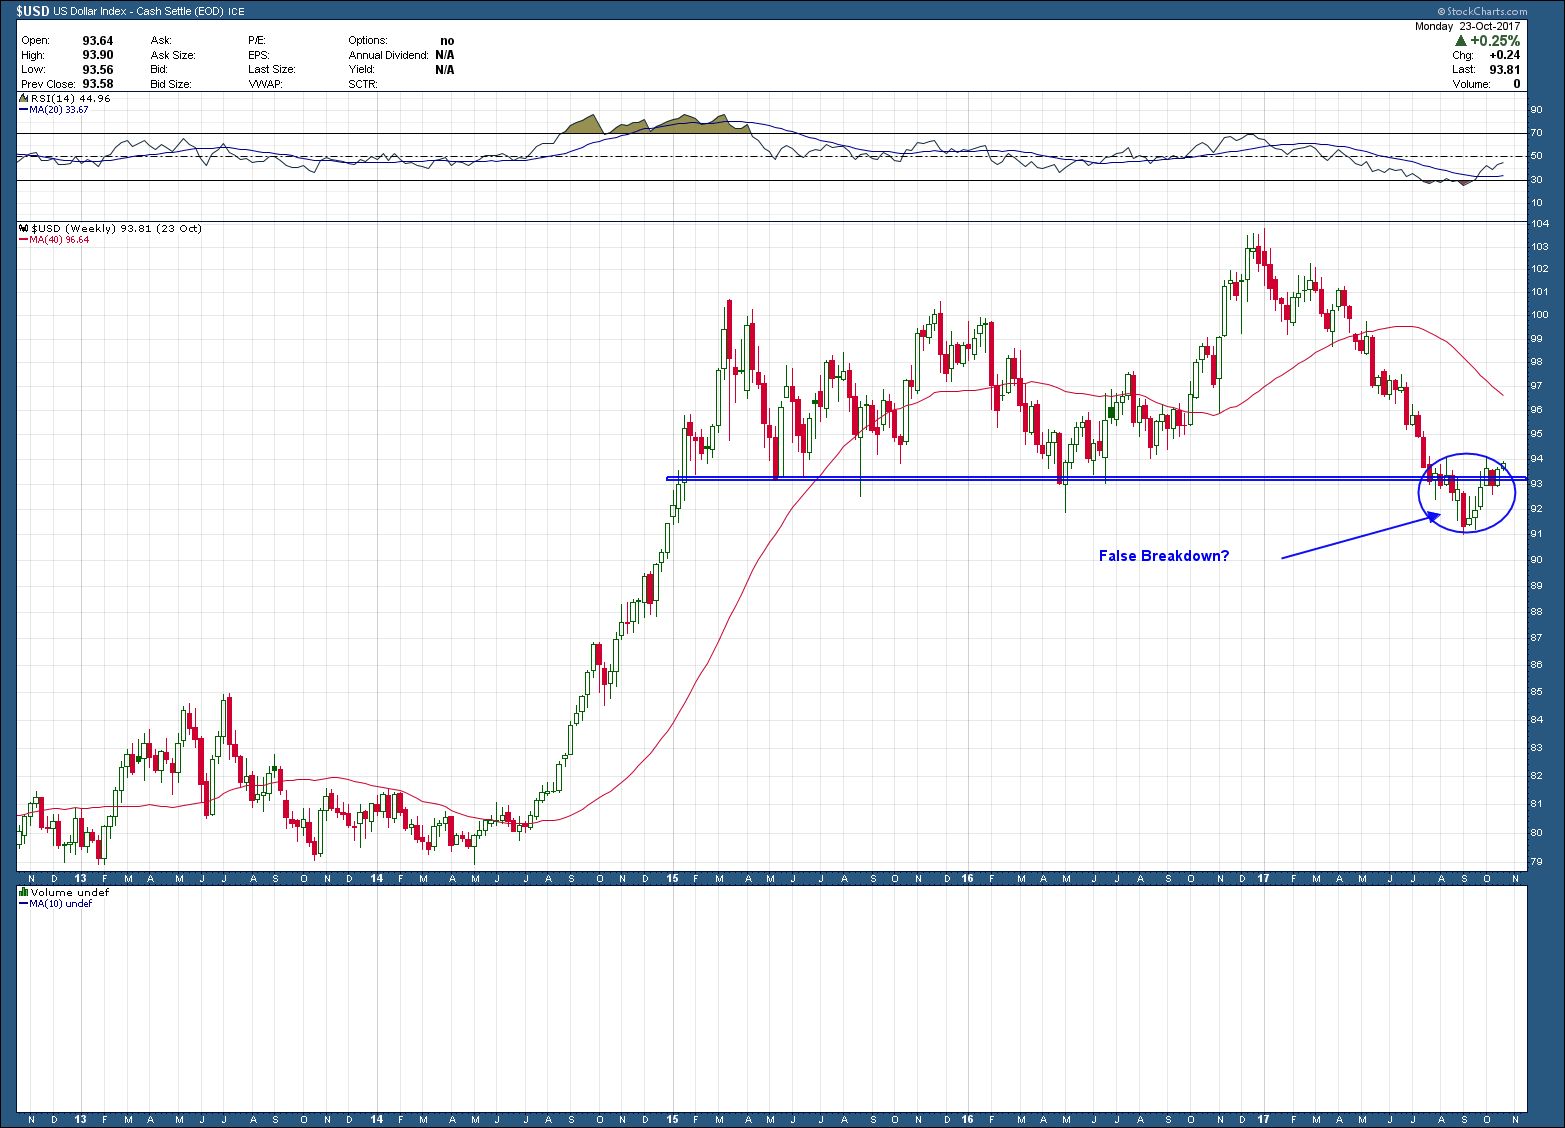
The US Dollar has been beaten up since peaking in December of last year, as it has lost more than 12% since then.  I have been a strong dollar bull advocate since its breakout in 2014 but the recent consolidation with a breakdown below horizontal support at $92, forced me to throw in the towel. From a technical standpoint you can see in the weekly chart below how one could draw the conclusion $92 was the last bastion of support before a complete breakdown was imminent. Well, as it turns out that is not completely correct. As I mentioned in my video, when prices breakout (up or down) from major areas of support or resistance, one needs to be aware of the possibility it turns out to be a fake out. A false break. False breaks usually bring powerful rallies in the opposite direction.

Bay area fee only wealth advisor and retirement planning CDP -10-25-17 - USD weekly.png

 Using longer term weekly charts help identify direction and POSSIBLE reversals but it is imperative to use shorter term views to zero in on for early confirmation and better entry/exist points. As you can see in the daily chart below, the dollar has formed (but not yet confirmed) an almost perfect symmetrical inverse head and shoulders reversal pattern while printing a divergent RSI momentum low. The pattern, if confirmed and plays out, points to an upside target at T1.

Bay area fee only wealth advisor and retirement planning CDP -10-25-17 - USD daily.png

The bottom line here is if the dollar begins an intermediate term rally, investors need to understand the potential negative ramifications a rising dollar has on owning investment that typically move inversely such as commodities, other currencies, precious metals and foreign investments. But because at this point the current setup is nothing more than a warning shot, it warrants keeping a very close eye on and keeping an open mind to a resolution in either direction.