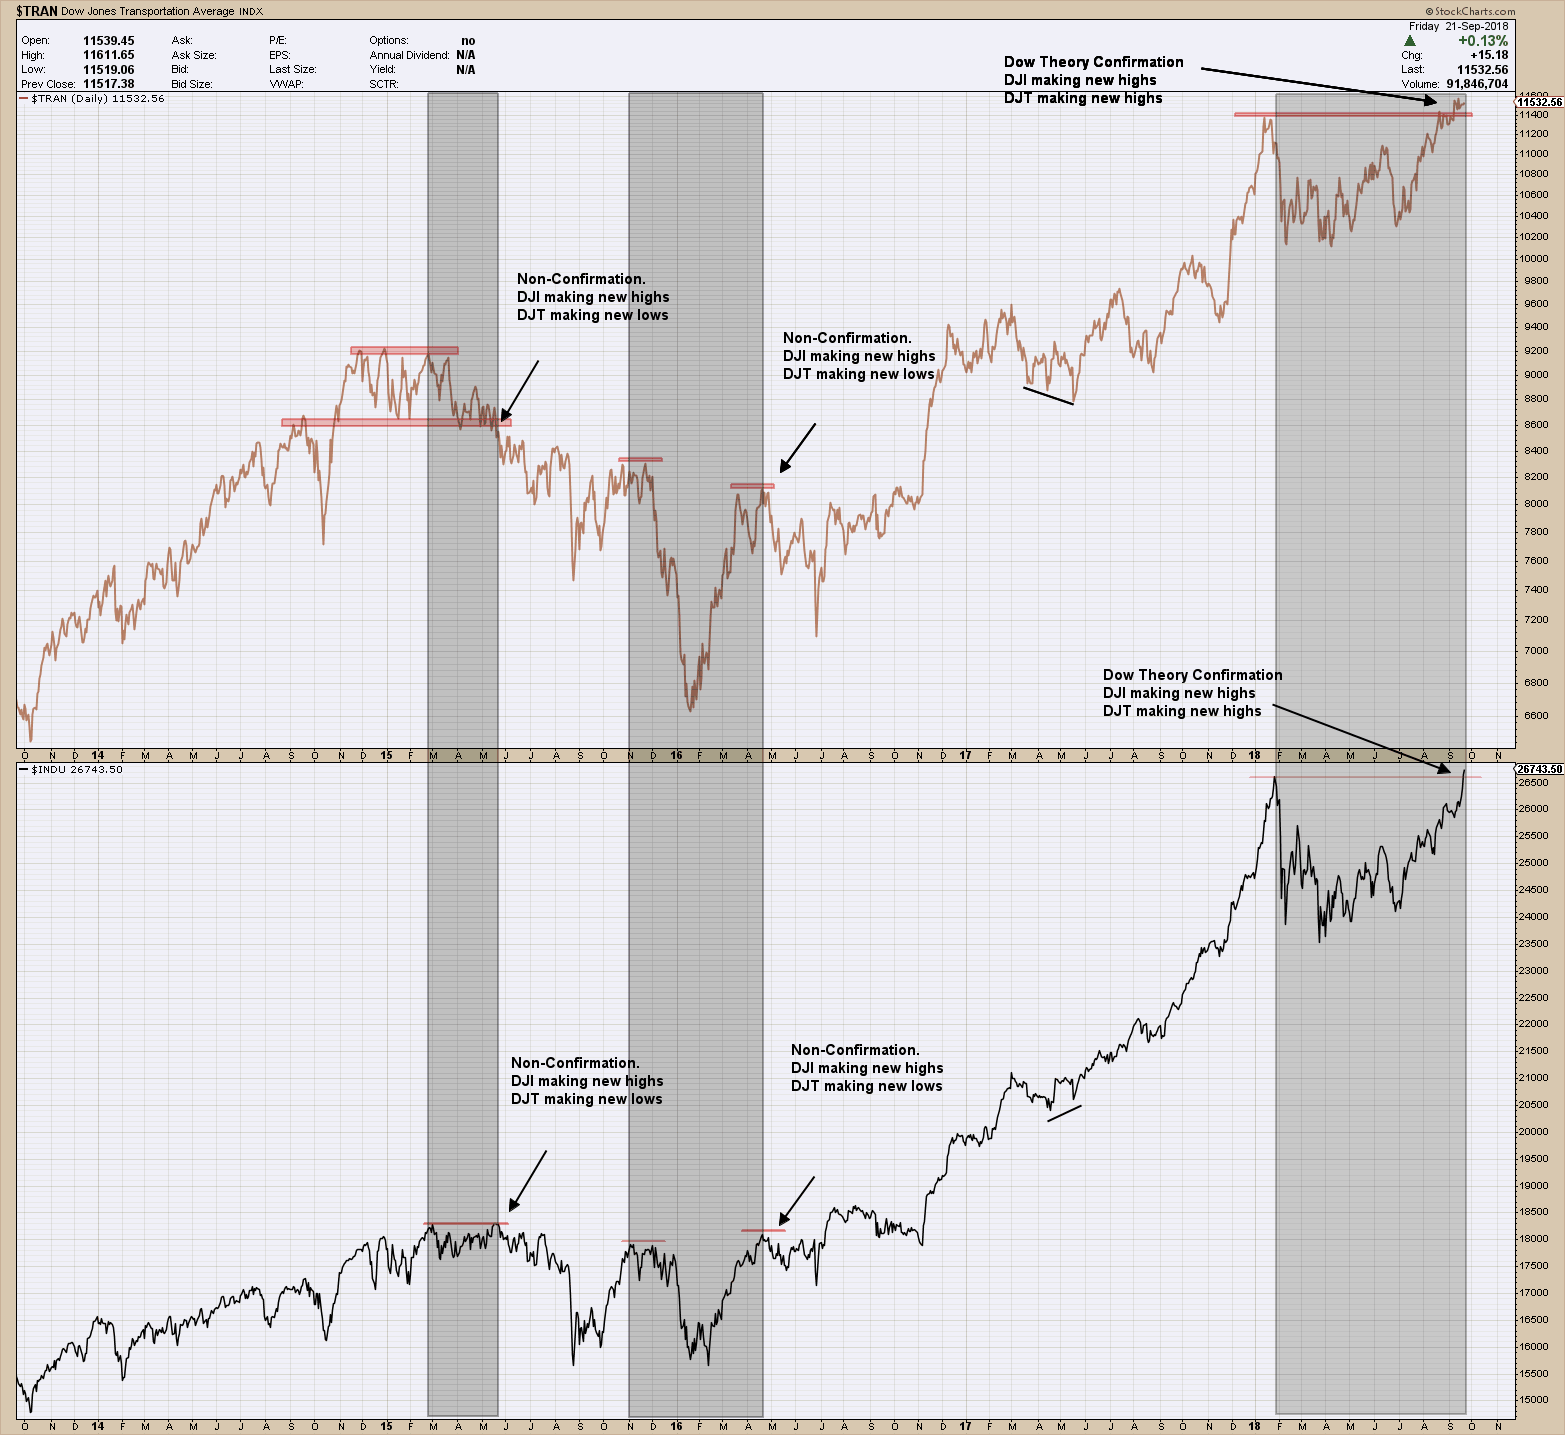
I’ve talked about the Dow Theory here in past blog posts but for those that didn’t read or want a refresher, you can go here. Like all timing models, it has periods of either out or under-performance. As such, knowing which period you are entering if you are using as a signal is an unknown. Digging a bit deeper at Dow’s theory and its results, it shows some interesting attributes.
The “classical'” Dow Theory under-performed “buy and hold” most of the time. All timing systems, and all Dow Theory “flavors” undergo rough patches. Under performance spells also affect the canonized “classical” Dow Theory.
However, in spite of such under performance most of the time, over the long term the classical Dow Theory achieves greater returns with a much lower risk.
Interestingly, the Dow Theory under performs when there is no danger out there. In good years for the stock market, the Dow Theory, while remaining solidly positive, returns less than buy and hold.
The Dow Theory outperforms buy and hold when it is most needed: When stocks are going down. The average annual performance of the Dow Theory when it is outperforming is a loss of 0.95%. However, buy and hold returned in those years a dismal -16.72% on average.
You may be puzzled to learn that the Dow Theory under-performs when the stock market is in a “good” year (namely when it goes up solidly). However, this has an easy explanation. As with any market-timing system, the Dow Theory never gets us “aboard” at the start of a new bull market. At the risk of oversimplifying we can say that 10% of any new bull market is always lost as the bull market always signal comes after its inception. When the market goes up in an almost straight line, by definition the Dow Theory will lag in returns.
However, what results in under performance in “good” times, is out-performance in “bad” times. When the market heads south and buy and hold gives away all the unrealized gains, the Dow Theory does an excellent job in getting the investor out of the market to avoid most of the decline.
Of course, the best environment for the Dow Theory is a long and sustained bull market where the primary bull market swing lasts more than one year uninterrupted. These are the years when the Dow Theory gets aligned with buy and hold as it remains fully invested along the never-ending primary trend. However, such blissful environment (for both Dow Theorists and buy and hold investors) occurred only 29.4% of the time. Furthermore, if markets were always in such a perfect bullish mood, there would be no need for the Dow Theory or any other market timing system for this matter. Investing would be a piece of cake (Yes, markets actually go down 😊)
As the market tends to have more “good'” years than “bad" years, it is not surprising the Dow Theory under performs most of the time. The take away is Its value lies in out-performing when it is most needed: When the going gets tough.


