Investments

Snap Back?

In spite of the buzz that surrounded Wall Street’s must have IPO, SNAP, was a horrendous IPO for initial investors. The price peaked on March 3rd, just one day after it opened and been falling ever since. In fact it lost almost 60% (peak to trough) leaving the early adopters holding a much lighter bag. What is really interesting is that the low made in price is exactly the average age of the apps user base. Coincidence? You be the judge J

For those looking for a short-intermediate term trade or a patient investor who wants to own SNAP long term, the chart is presenting investors an interesting setup.  As you can see yesterday’s close created a hammer candlestick on very large volume indicating a potential bottom is in place. For confirmation, you need to see follow through on the next day which is exactly what happened as price gapped higher and again on above average volume. Armed with this technical setup and combined with the fact RSJ momentum has created an oversold, (positive) divergent low we have an almost ideal, low risk-high reward buying opportunity.  With no real resistance until price reaches the first upside target at the bottom of the first gap (a 35% + rise) and a stop just below Thursday’s hammer candle low, substantially exceeds the desired 3:1 reward to risk ratio I want to see before committing investment capital. If SNAP really has legs and glides right through the lower gap, the next target would be the upper gap, some 80% from its bottom.   

San ramon fee only CFP certifited financial planning independent investment advisor - 8-7-17 - snap

In spite of the compelling upside potential, because of the limitations restrictions SNAP management has built into the company’s public shares, I have no interest in owning them long term. As such, I view any investment in SNAP as a short term rental.

Transports – At a Crossroad

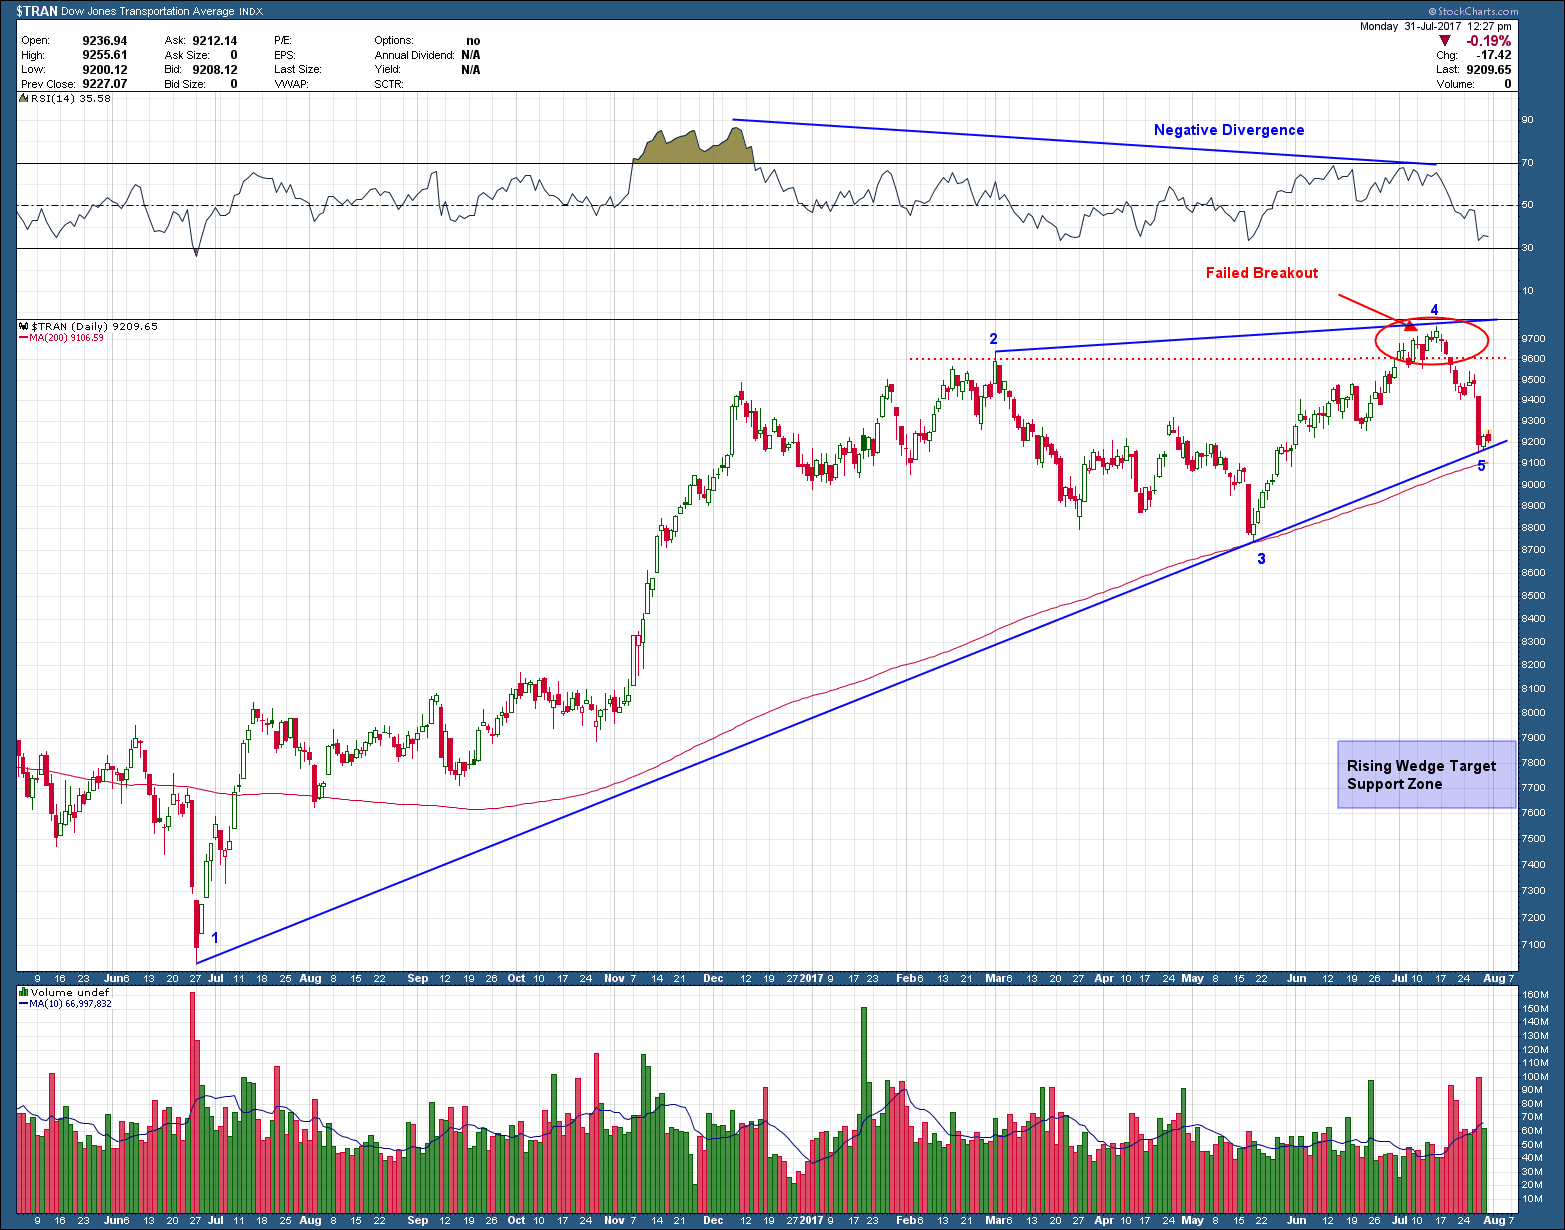
When reviewing my regular review of the US sector charts, the transportation index jumped out at me. And not in a good way, let me show you why.  You can see in the chart below, a 15 month look-back, price has formed a requisite 5 point, large (blue) rising wedge pattern. These patterns are typically bearish in nature and warn of lower prices, once confirmed. You can also where I have circled the area (near touch #4 of the rising wedge) where price broke out to new, all-time highs, held for a week and then reversed course retracing back to the bottom uptrend support line (touch #5) of the rising wedge. To add to the concern is normal poor upcoming stock market seasonality combined with negative momentum divergence (momentum is making lower high at the time when price is making a higher high).     

I wanted to post this since it is at a major crossroad here and will likely resolve itself in the next week or two.  I find it more educational and a better learning tool to post these in real time rather and watch them develop than point them out in the rear view mirror.

The bottom line is that support is support and until it is broken, this setup is nothing more than a pullback within a longer term uptrend. Because of the importance of the transportation stocks, a breakdown tough would likely pull the rest of the market down with it. If price were to reach the pattern target it would be more than a 20% decline, something stocks have not experienced for many years (but are typically regular occurrences of bull markets).

Bay area independent investment advisor and San Ramon fee only NAPFA retirement planning CFP.png

I hesitate to post bearish setups and try to keep my post more positive in nature as I have learned from feedback it freaks some investors out. I do it for those that want to look at possibilities as it then will not come as a surprise if it does occur. Forewarned is forearmed. It’s good to reiterate here before I close that I am speaking only in “possibilities” not foregone conclusions. The higher probability outcome is for price to consolidate and move higher without breaking down. That is what has happened every time since the 2009 bottom why should we expect anything different this time?   Either way it’s great to remember pullbacks whether it be 5% or 20%, create wonderful buying opportunities for the next leg up in bull markets.

Another Chance?

My April 5th blog post highlighted the compelling investment opportunity that was setting up in the Portuguese stock market using the proxy PGAL. At the time of writing price was at prior resistance, just under the red horizontal line, R1 in the chart below. As you can see, after a brief post blog report consolidation, price jumped strongly through resistance on substantial volume and climbed higher to the next logical resistance zone, R2. Like what occurred when PGAL approached R1, hitting R2 caused it to repel backward and consolidate.

The consolidation allowed the bulls to reload and make another attempt at breaking through R2. With volume patterns mirroring the ideal combined with the shallowness of the pullback, the probability is we see PGAL bust right on through resistance and eventually tag the first target, T1 above. A gain of 30% from my April post.  If the momentum continues in earnest, T1 won’t be difficult to attain and T2 would be next on the radar and maybe (be careful as my cold medications may be effecting my objectivity J) even a retest of prior highs at $16.5.

For those that took the original signal, congratulations. Hang on as it looks like there is a lot more in store. For those that missed out, a confirmed breakout above R2 offers another compelling (not quite as compelling as R1 was obviously) profit opportunity. As always, before any investment opportunity is taken, a position management plan need be created and adhered to. The good news is that breakouts are as easy as they come. A break back below the original breakout level provides an ideal “get the heck out of dodge” sell signal.  Good luck! 

Bay area independent investment advisor san ramon fee only certified financial retirement planner CFP - 7-24-17 - PGAL

The Dollar Down Under

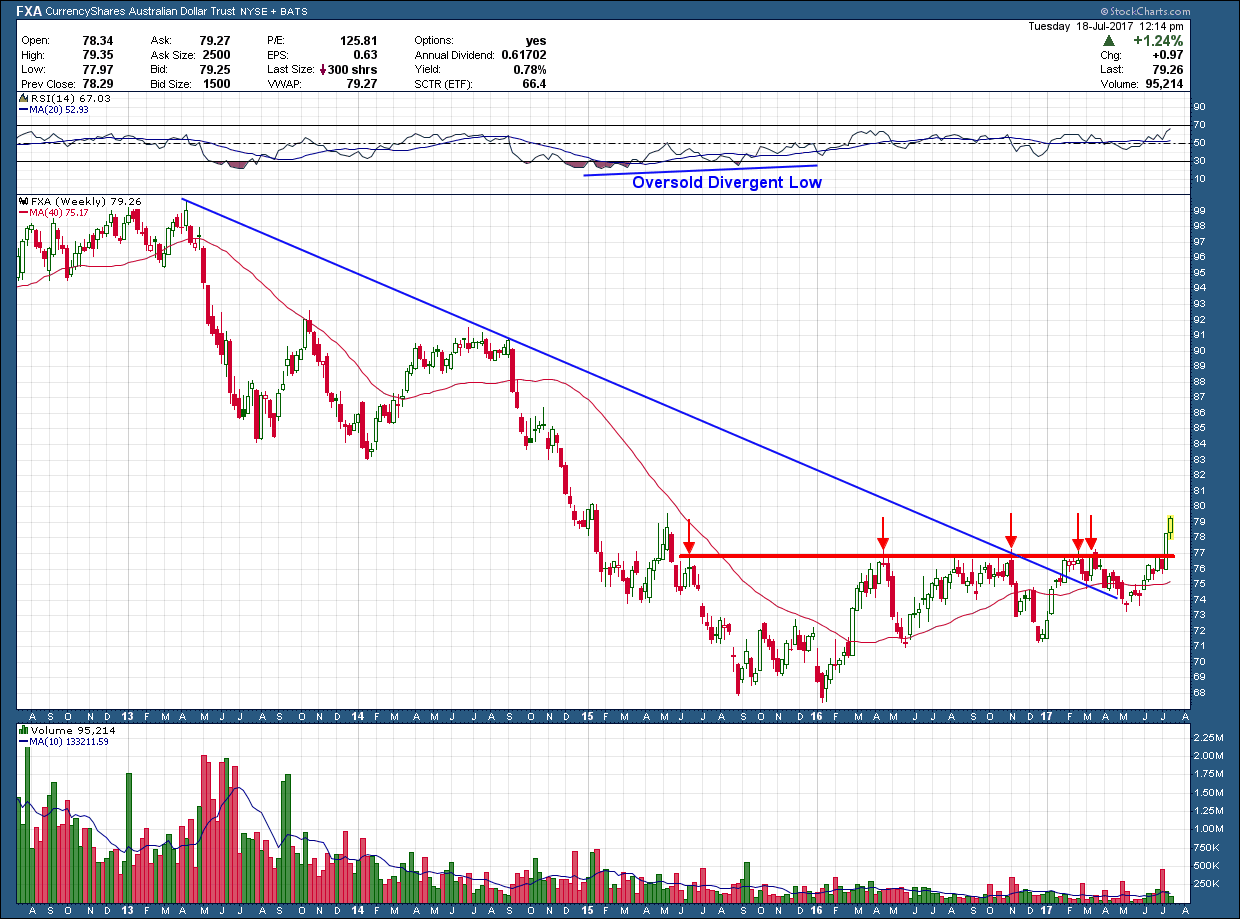
The Australian dollar, like other currencies has had a tough of it over the past few years. After peaking in April 2013 it declined more than 30% in value, bottoming in January of last year. That bottom, like most major declines, formed a divergent momentum low marking a high probability interim low was established. Since that point it attempted (and failed) 4 times to get over the $77 threshold.

San Ramon indpendent investment advisor certified financial planning retirement specialist CFP wealth manager - 7-19-17 -FXA

Not until last week did it have enough oomph to break that level as it did so with a huge move. In addition, price broke above the blue, long-term downtrend line and sits above a rising 200 day moving average. These are all things we want to see when trying to pick a bottom. The upside target for this breakout is up at the $86-$87 level. Since that is mid- congestion, it could get extended, if it wants to run all the way up to $92.  From a management standpoint breakouts are as simple as they come.  Sell on a break below support which provides greater than a 4-1 reward for every dollar you risk.

An Invitation to China's Breakout Party

After more than a 45% decline China’s ETF, FXI, found a bottom early last year and has been moving higher ever since. Earlier in May of this year it retested October 2015’s prior high (~$40.5) and failed.  This should come as no surprise because prior resistance will continue to act as resistance until it is broken through in which case it becomes support.

Unlike what happened in Oct 2015, the bulls this time had enough in the tank to push strongly through resistance last week. Notice how this time price is above the (red) 200 day moving average which is now rising rather than falling. While not spectacular, volume was almost 20% higher than its average which helps confirm last week’s break out is likely the real deal and worth consideration in your portfolio.

After breakouts, investors want to see a follow through the next week preferably with a big white candle like the one that printed last week and on continued large volume. But the market does not always give us what we want so we need to be prepared for a pullback and retest of the prior $40.5 resistance line (which now should act as support). If that occurs and price holds, those that missed this breakout buy would be provided what I would consider a nice second chance on what looks to be an excellent opportunity.  The (ascending triangle) pattern upside target, if the market wants to go higher, is back near the 2015 prior high around $52 a 30% rise from the breakout level.

San ramon independent investment advisor certifed financial planner, CFP NAPFA fee only - 7-17-17 -china