Retirement

Will 2018 Bring the Return of Inflation?

The strength of the global economy is one reason why the stock market has started 2018 in a buoyant mood (with the Dow passing 25,000). At some point, in any expansion, businesses find it harder to recruit workers or get the materials they need; these bottlenecks cause wages and prices to rise. Central banks then start to tighten monetary policy, a process that can eventually turn the market (and the economy) down (recession). For years the US has been in a deflationary environment in spite of the FED’s ongoing attempts to do everything possible to create inflation but that looks like 2018 may signal a change.

Because commodities rise in an inflationary environment, following their price can be very profitable for investors in the back-end of the business cycle. The $CRB index is a basket of 19 liquid and highly diverse individual commodities is about the best proxy I have found which can help determine the direction of commodity prices. Taking a look at the chart of $CRB we see the index has been in a severe downtrend from 2014-2016 and after bottoming has consolidated sideways for 2 years. But it looks like it may soon change as it is attempting to breakout to the upside.  The consolidation is forming an inverse head and shoulders bottom pattern which projects, if it breaks out and confirms, to the 2015 highs, almost 30% higher.

San Ramon fee only fiduciary certified financial advisor and independent retirement planning CFP  crb - 1-8-18.png

I have learned the hard way that commodities are a fickle group and are not as reliable as stocks are when looking at charts and attempting to interpret what is next. As such I prefer to get additional confirmation before committing investment capital. What better confirmation than looking at the biggest market of all, bonds and see what, if anything, they are saying. You may be asking what do bonds have to do with commodities. The common thread is inflation so checking in on TIPS (Treasury inflation protected securities) makes a lot of sense.

In the chart of TIPS below you can see that they, like the $CRB index are knocking on the door looking as if they want to break out to the upside. The cup and handle continuation pattern that has formed points to a target move of 5% higher (don’t scoff, that’s a big move for bonds)

bay areas best fee only fiduciary certified financial advisor and independent retirement planning CFP -tip - 1-8-18.png

Whether we see inflation or not will only be known later in time. With both commodity prices and TIP bonds looking as if they want to go higher, is a signal the markets believe inflation may not be too far around the corner. As with all pattern breakouts, you should never invest unless the pattern triggers and confirms, which neither the $CRB or TIPS have yet done. Until then, it will pay to watch these two closely in the coming weeks/months for investment opportunities. 2018 may be shaping up to be a great year for inflation hedged investments

It's Coming, Are You Ready?

Automation may wipe out 1/3 of America’s workforce

In a new study that is optimistic about automation yet stark in its appraisal of the challenge ahead, McKinsey says massive government intervention will be required to hold societies together against the ravages of labor disruption over the next 13 years. Up to 800 million people—including a third of the work force in the U.S. and Germany—will be made jobless by 2030, the study says.

The bottom line: The economy of most countries will eventually replace the lost jobs, the study says, but many of the unemployed will need considerable help to shift to new work, and salaries could continue to flatline. "It's a Marshall Plan size of task," Michael Chui, lead author of the McKinsey report.

In the eight-month study, the McKinsey Global Institute, the firm's think tank, found that almost half of those thrown out of work—375 million people, comprising 14% of the global work force—will have to find entirely new occupations, since their old one will either no longer exist or need far fewer workers. Chinese will have the highest such absolute numbers—100 million people changing occupations, or 12% of the country's 2030 work force.

The details:

  • Up to 30% of the hours worked globally may be automated by 2030.
  • The transition compares to the U.S. shift from a largely agricultural to an industrial-services economy in the early 1900s forward. But this time, it's not young people leaving farms, but mid-career workers who need new skills. "There are few precedents in which societies have successfully retrained such large numbers of people," the report says, and that is the key question: how do you retrain people in their 30s, 40s and 50s for entirely new professions?
  • Just as they are now, wages may still not be sufficient for a middle-class standard of living. But "a healthy consumer class is essential for both economic growth and social stability," the report says. The U.S. should therefore consider income supplement programs, to establish a bottom-line standard of living.
  • Whether the transition to a far more automated society goes smoothly rests almost entirely "on the choices we make," Chui said. For example, wages can be exacerbated or improved. Chui recommended "more investment in infrastructure, and that those workers be paid a middle wage."
  • Do not attempt to slow the rollout of AI and robotization, the report urged, but instead accelerate it, because a slowdown "would curtail the contributions that these technologies make to business dynamism and economic growth."

September 2017 Charts on the Move Video

With 3/4 of the year in the books, the US stock market is moving towards a very bullish seasonality period. If nuclear bombs and Washington tweet bombs cant bring it down are we setup for a year-end barnburner? My recap of September can be seen in the video link below.

https://youtu.be/YcmxMQ4ZC-g

July 2017 Charts on the Move Video

With the markets and investors apparently lulled into a bullish induced coma (not unlike what happens to Homer Simpson when he sees doughnuts), seasonality tells us to expect more of the same for August. Instead with the extreme levels of complacency,  extended price levels, this would be an ideal time for investors to revisit their management plans ... justin case.  

My July highlights in the video link below.

https://youtu.be/JlYFRKRhA6Y


Transports – At a Crossroad

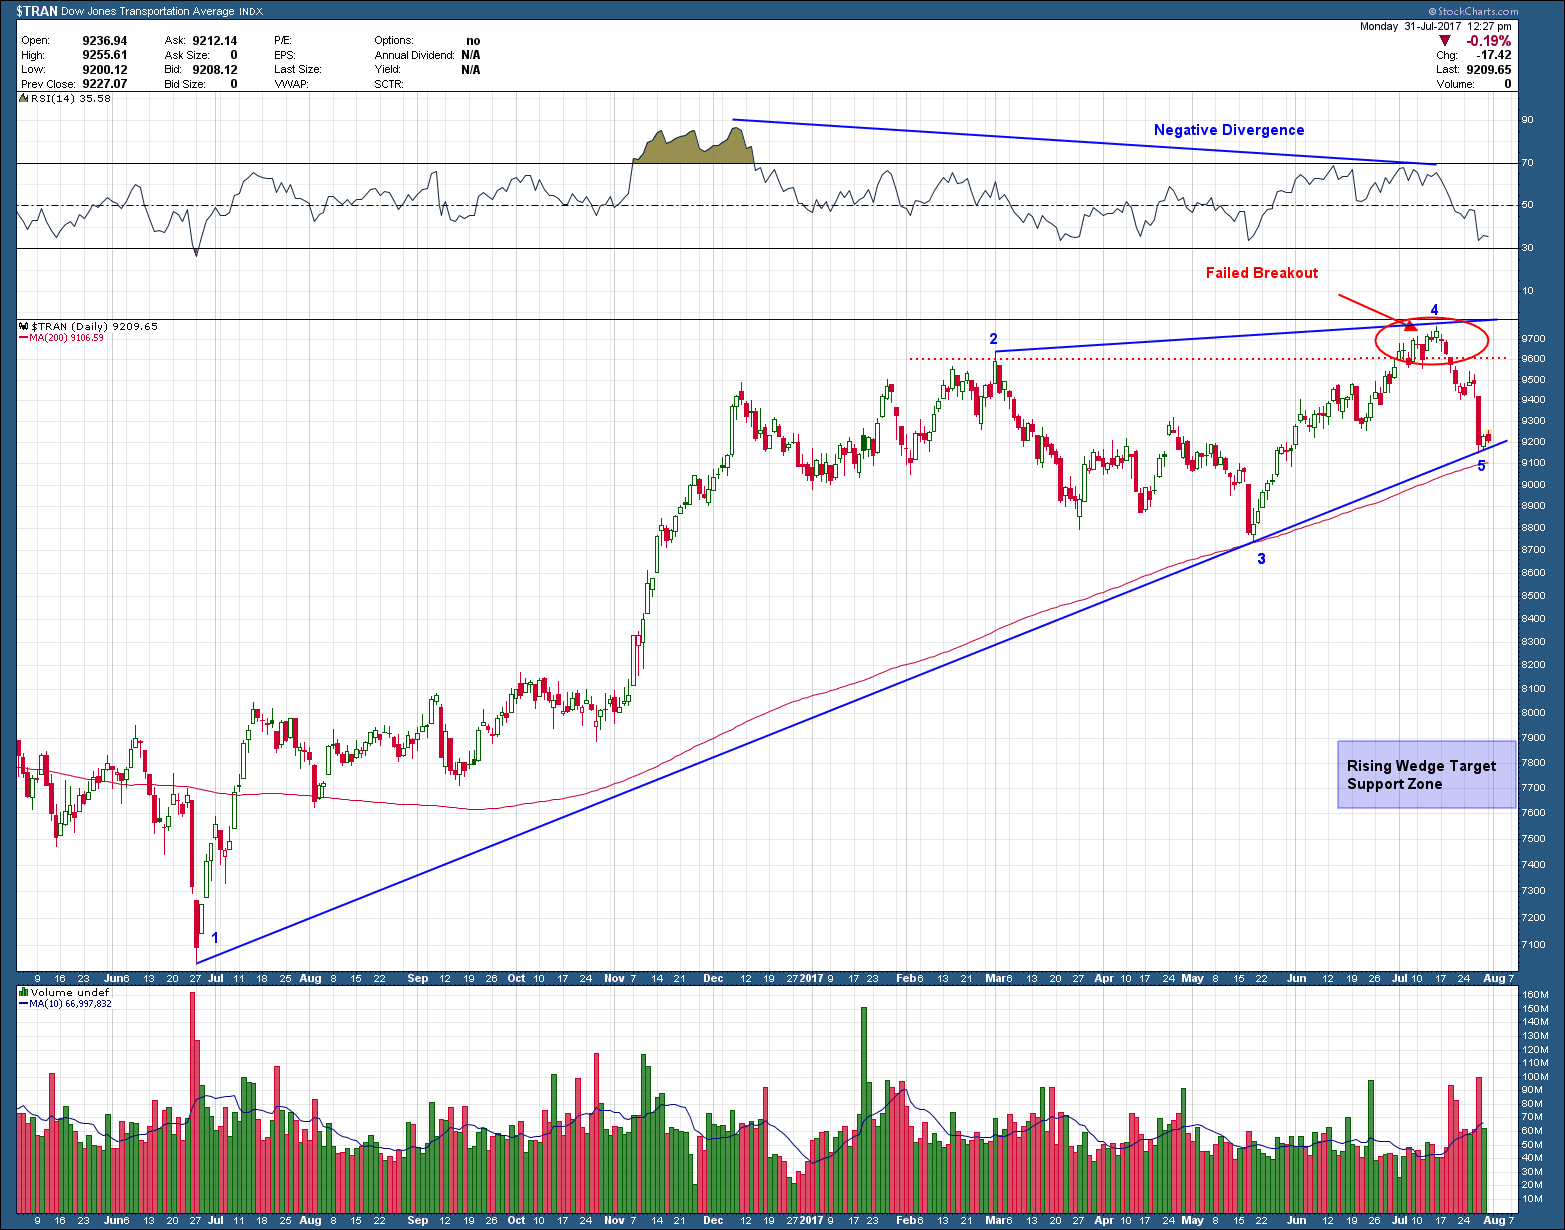
When reviewing my regular review of the US sector charts, the transportation index jumped out at me. And not in a good way, let me show you why.  You can see in the chart below, a 15 month look-back, price has formed a requisite 5 point, large (blue) rising wedge pattern. These patterns are typically bearish in nature and warn of lower prices, once confirmed. You can also where I have circled the area (near touch #4 of the rising wedge) where price broke out to new, all-time highs, held for a week and then reversed course retracing back to the bottom uptrend support line (touch #5) of the rising wedge. To add to the concern is normal poor upcoming stock market seasonality combined with negative momentum divergence (momentum is making lower high at the time when price is making a higher high).     

I wanted to post this since it is at a major crossroad here and will likely resolve itself in the next week or two.  I find it more educational and a better learning tool to post these in real time rather and watch them develop than point them out in the rear view mirror.

The bottom line is that support is support and until it is broken, this setup is nothing more than a pullback within a longer term uptrend. Because of the importance of the transportation stocks, a breakdown tough would likely pull the rest of the market down with it. If price were to reach the pattern target it would be more than a 20% decline, something stocks have not experienced for many years (but are typically regular occurrences of bull markets).

Bay area independent investment advisor and San Ramon fee only NAPFA retirement planning CFP.png

I hesitate to post bearish setups and try to keep my post more positive in nature as I have learned from feedback it freaks some investors out. I do it for those that want to look at possibilities as it then will not come as a surprise if it does occur. Forewarned is forearmed. It’s good to reiterate here before I close that I am speaking only in “possibilities” not foregone conclusions. The higher probability outcome is for price to consolidate and move higher without breaking down. That is what has happened every time since the 2009 bottom why should we expect anything different this time?   Either way it’s great to remember pullbacks whether it be 5% or 20%, create wonderful buying opportunities for the next leg up in bull markets.