Socio-economic

$60 Trillion of World Debt

I saw this chart posted by visualcapitalist.com and had to forward it along. While it has little to do with investing, it is an obsession of mine. I am a firm believer that one day we will have to face the piper and have our day of reckoning.  While debt isn’t evil, the level of debt we (the US) have almost fits that description. But the interesting thing is, and maybe provides some solace, is looking across the global landscape it appears as if there are a few countries/regions that may have to face the piper before we do. Ultimately though, our day will come.

As you can see the chart breaks down $59.7 trillion of world debt by country, as well as highlights each country’s debt-to-GDP ratio using color. The data comes from the IMF and only covers public government debt. It excludes the debt of country’s citizens and businesses, as well as unfunded liabilities which are not yet technically incurred yet. All figures are based in USDollars.

The numbers that stand out the most, especially when comparing to the previous world economy graphic:

  • The United States constitutes 23.3% of the world economy but 29.1% of world debt. It’s debt-to-GDP ratio is 103.4% using IMF figures.
  • Japan makes up only 6.18% of total economic production, but has amounted 19.99% of global debt.
  • China, the world’s second largest economy (and largest by other measures), accounts for 13.9% of production. They only have 6.25% of world debt and a debt-to-GDP ratio of 39.4%.
  • 7 of the 15 countries with the most total debt are European. Together, excluding Russia, the European continent holds over 26% of total world debt.
  • Combining the debt of the United States, Japan, and Europe together accounts for 75% of total global debt.  Yet, combining their population they account for less than 25% of the world’s total humans
HOW MUCH MONEY DO I NEED TO RETIRE - SAN RAMON FEE ONLY INVESTMENT ADVISOR, CFP FIDUCIARY

Time for a Different Approach?

Whether you are an Obamacare advocate or not, the following chart screams out the need for a fundamental shift in the way we handle health care it if we expect to fix the crisis.

San ramon independent fee only CFP retirement specialist and asset manager

I know I will hear from some saying life expectancy is not the best or only measure of a good health care system and I can agree.  But our standard response of throwing more and more money at a problem clearly has not provided the best outcome so maybe it’s time to reset and try a different approach.

Rotation

There was some rotation out of bonds and into stocks since the election and there has been some rotation within the stock market itself. As you would expect the high yield investments (REITs, utilities, consumer staples) have all underperformed as long bond rates have spiked higher. The bond market lost more than $1T (yes, that is one trillion dollars) last week.

san ramon's best independent cfp financial planning advisor 11-14-16

It appears as if money managers and investors are setting up for what they believe will be the new winners once Trump takes office. Materials and other inflation/growth vehicles were on an abbreviated week tear. Technology, the past 7 year darling could get out if its own way as it was lower in spite of the post-election rally. The broader stock market shifted into a lower gear for the time being, having lost the support of its most influential sector and most of the influential momentum stocks.

Things are a changin’

Here’s what I want you to take away from the week that was. In fact, if you remember nothing else, remember this: Markets stall or sell off on uncertainty and they rally hard on certainty. Markets like answers. They don’t like President Trump any more or less than they like President Clinton.  They will adapt. Will you?

Electoral Overload

336 stocks are down more than 20% for the past month. Only 36 are up more than 20%

independent bay area cfps advisor - sp500 11-7-16

The SP500 made it nine sessions in a row of declines on Friday.  The first time in 36 years. But it is only down 3% over those 9 days, unlike the previous occasions which saw a drop of -7% on average. This shows relative strength..  In the past 86 years, there have been 22 occasions of 9 down days.   Six months later SP500 was up 74% of the time with an average return of +9%.  For 12 months, a rise of +14%. The average loss was -7%. These down streaks have historically been good buying opportunities, Will it be this time?

Sentiment says we are getting close to a bounce as the boat is over-crowded on one side.

fee only independent financial planning advisor - sentiment - 11-7-16

Recent market gyrations are a byproduct of the uncertainty around the election. In two days it will be over and only then are we likely to see what hand Ms. Market is playing. Until then, it’s all noise.

Get the Door

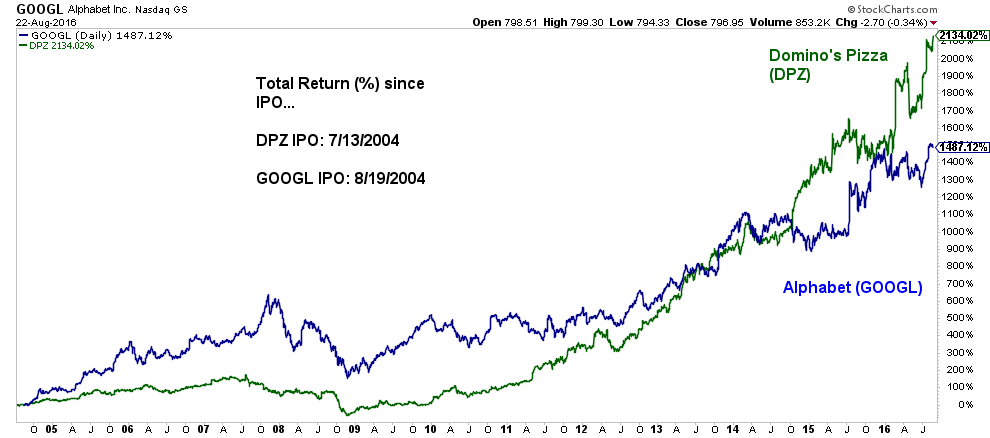
If I asked you what company had the most successful IPO since 2004 (based upon share price increase) if you are like me the first company that came to mind would be Google or maybe some other tech giant.  If so, you would be wrong like I was.

Pleasantons best bay area financial advisor, retirement planneing CFP

Who'da thunk? I guess I must be the only person in North America to have never had the pleasure of tasting #1.