Electoral Overload

336 stocks are down more than 20% for the past month. Only 36 are up more than 20%

independent bay area cfps advisor - sp500 11-7-16

The SP500 made it nine sessions in a row of declines on Friday.  The first time in 36 years. But it is only down 3% over those 9 days, unlike the previous occasions which saw a drop of -7% on average. This shows relative strength..  In the past 86 years, there have been 22 occasions of 9 down days.   Six months later SP500 was up 74% of the time with an average return of +9%.  For 12 months, a rise of +14%. The average loss was -7%. These down streaks have historically been good buying opportunities, Will it be this time?

Sentiment says we are getting close to a bounce as the boat is over-crowded on one side.

fee only independent financial planning advisor - sentiment - 11-7-16

Recent market gyrations are a byproduct of the uncertainty around the election. In two days it will be over and only then are we likely to see what hand Ms. Market is playing. Until then, it’s all noise.

October Charts on the Move Video

The markets are at a crossroad and looking very heavy and susceptible. The right catalyst (the election results?) could be a set up for a big move in either direction. Short term downtrends and break of critical support are fighting with positive seasonality. Which one wins only time will tell. Either way, active investors need to be nimble here. In my video below i share what i am looking for.

https://youtu.be/vOV0E6Z7MrQ

Mind the Gaps

I often mention gaps in price movement but have never done an example post  … until now.  In my 9-28-16 blog post Beast Mode I wrote about the consolidation occurring in ACIA stock. As is always the case with consolidations there are only two eventual outcomes, one bullish and the other bearish. I wrote

The stakes and return on this investment is big so it’s important to get it right. For me a close and hold above prior $128.73 highs is the confirmation I would be looking to go long. If, on the other hand, price closes and stays below the red horizontal support line at $102, I would expect a quick and violent decline back to fill the open gap below

Below is a re-annotation of the original chart I posted cleaning up some of the noise and making the gap I was referring to more apparent.

A gap is an area on a price chart in which there were no trades. Normally this occurs between the close of the market on one day and the next day's open. Lot's of things can cause this, most of the time it is news driven such as an earnings report coming out after the stock market has closed for the day. If the earnings were significantly higher than expected, many investors might place buy orders for the next day. This could result in the price opening higher than the previous day's close. If the trading that day continues to trade above that point, a gap will exist in the price chart. Gaps can offer evidence that something important has happened to the fundamentals or the psychology of the crowd that accompanies this market movement.

There is an old saying that the market abhors a vacuum and all gaps will eventually be filled is why in my post I said

If, on the other hand, price closes and stays below the red horizontal support line at $102, I would expect a quick and violent decline back to fill the open gap below

The chart below is that of ACIA but brought up to date as of Friday’s close.

independent bay area certified financial planner advisor - acia - 10-28-16

The 30% decline in less than 3 weeks fits my definition of a violent decline. While I would expect at least a small period of consolidation after filling the gap, momentum is still falling and price is just beginning to reach oversold conditions as such it looks like ACIA has more downside. If you took the short trade as mentioned in my original post, you have a handsome profit and this is a level I would be taking at least half off the table. I very much like ACIA long term and will likely find a place for it in our portfolios but that won’t occur until all selling has exhausted and we begin a new uptrend.  When and at what level that will occur, only time will tell.

The take away here is gaps are a significant technical development in price action and chart analysis, provide important clues about potential future support and resistance levels and as such should hold a place near and dear to all investor’s hearts.

Some Viagra for the Bears

If you are an Under Armor stockholder, this is available without prescription.

1.       Broken rising uptrend line

2.       Negative Divergence

3.       Price below a downward sloping 200 day moving average

4.       Price teetering on Head and Shoulders neckline

5.       Lower highs and lower lows

best bay area retirement planning independent investment advisor UA 10-26-16

After an impressive 5-year run of more than 500% Under Armor is on the ropes.  A break of the current support and hold could be all the UA bears need as the downside target for this pattern is way down at the (GULP!) $12 level, some 60% lower.

Before I get more hate mail, I need to reiterate I am only reporting what the charts are saying. Nothing more, nothing less. This is NOT a prediction or a guarantee. In any case, the pattern has yet to trigger and until it does it’s just a plot of UA price over 5 years.

Oil Conundrum

The short and intermediate fundamental term outlook for oil prices continue to look weak as demand falters and supply continues to be robust. Just last month the International Energy Agency provided the following bearish backdrop forecast for future oil prices:

“The surplus in global oil markets will last for longer than previously thought, persisting into late 2017 as demand growth slumps and supply proves resilient. World oil stockpiles will continue to accumulate through 2017, a fourth consecutive year of oversupply.”

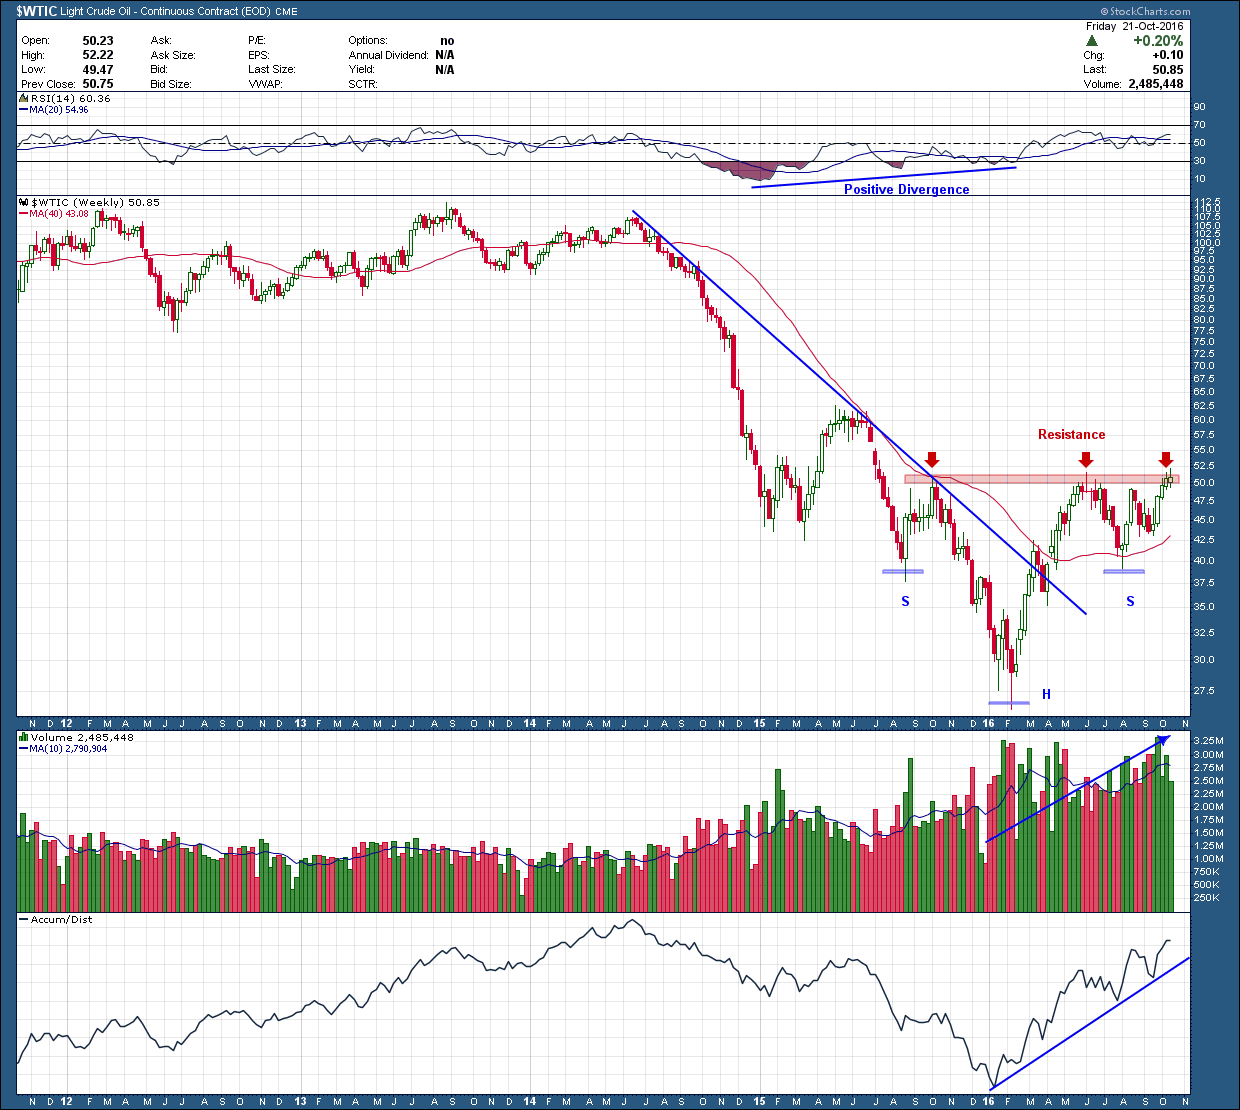
And yet I can hardly find a more bullish chart than that for oil. The 19 month, 75% (peak to trough) drop in price, came to an abrupt end in February of this year.  Notice how, during the decline, positive divergence formed in the upper RSI momentum pane on each successive low. After putting in a hammer candlestick bottom on Feb 16ths close, price reversed strongly and powered higher, pausing for a brief breather just after piercing the blue downtrend resistance line and eventually peaking at the logical ~$50 (prior resistance) level.

Bay areas best investment advisor and cpf independent fideuciary - WTIC - 10-24-16

After a healthy correction off $50, oil is once again to break through critical resistance.  As bulls want to see, both volume (3rd pane) and the advance/decline line (bottom pane) have been increasing from the Feb. bottom confirming the strength and legitimacy of the move. Additionally, price is holding above a rising (red) 200 day moving average. Hopefully your eyes are becoming trained to look for patterns and were able to notice, without the aid of my annotations, the inverse head and shoulders bottom that if confirms and plays out to its target, projects to the $75 level.

Investing is so much easier and provides greater success probability when the stars and planets (technical and fundamentals) are aligned. But since this is not the case here what is an investor to do? Depending upon your risk tolerance one option would be to move on and wait for the ideal setup where all signal align. Another would be to wait for confirmation and jump on the opportunity but manage risk via both a reduction in position size and loss acceptance (exit strategy).  Whatever your style, the markets rarely provide “slam dunk” opportunities and when they do you’ll often find Ms. Market is playing you.

 “If you can’t find the sucker at the table, you’re it.”