When Failure is Good

The are few things as short term bullish than a failed breakdown at a level of major support. The breakdown has short sellers jumping in to take advantage of a continuation of downside action. A reversal (breakdown failure) and move back above support/resistance creates upside fuel as the short sellers are forced to cover, pushing the stock higher. Depending upon the amount of shares shorted, the ongoing cover could move the stock much higher, as momentum players will eventually add more fuel as they jump on board the train higher. The thing to remember and watch is that dynamics of movement around support and resistance can lead to big moves ... in both directions

GE, a company I have lost any interest investing in, after falling more than 60% in 2 years may have found a (temporary) bottom, setting up for a reversion to the mean trade.  As you can see in the chart below, GE’s price tested the $12.75 level at least 5 times before it finally failed mid-August and began another push lower.   

As can be the case with breakdowns, price stays below support for a couple of days and reverses. GE declined 3 days, printed a hammer reversal candle and has subsequently moved higher. Yesterday it closed right on the critical support/resistance zone. A move and hold higher points to potentially much higher prices. The first target being T1 and ultimately the possibility of retesting prior 2017 highs which would provide an almost double (100% return).

san ramon CFP investment advisor and fiduciary wealth manager - GE 8-29-18.png

Before we get lost in our dreams of a first-class trip around the world paid for with the windfall profits from a GE failed breakdown, it’s always important to frame the risks. That $12.75 area is key. A move and hold above (preferably on increased volume) is a signal to be long while a revisit and hold below, tells us to move on and put the first-class trip on hold.

Momentum

I have written about the numerous studies showing the case for momentum stocks being a core holding in your portfolio here in the blog. If you don’t know how to screen for momentum stocks or prefer not to mess with buying individual shares, there is an ETF from Ishares, MTUM.  It seeks to track the performance of an index that measures the performance of U.S. large- and mid-capitalization stocks exhibiting relatively higher momentum characteristics, before fees and expenses of course. Easy-Peasy

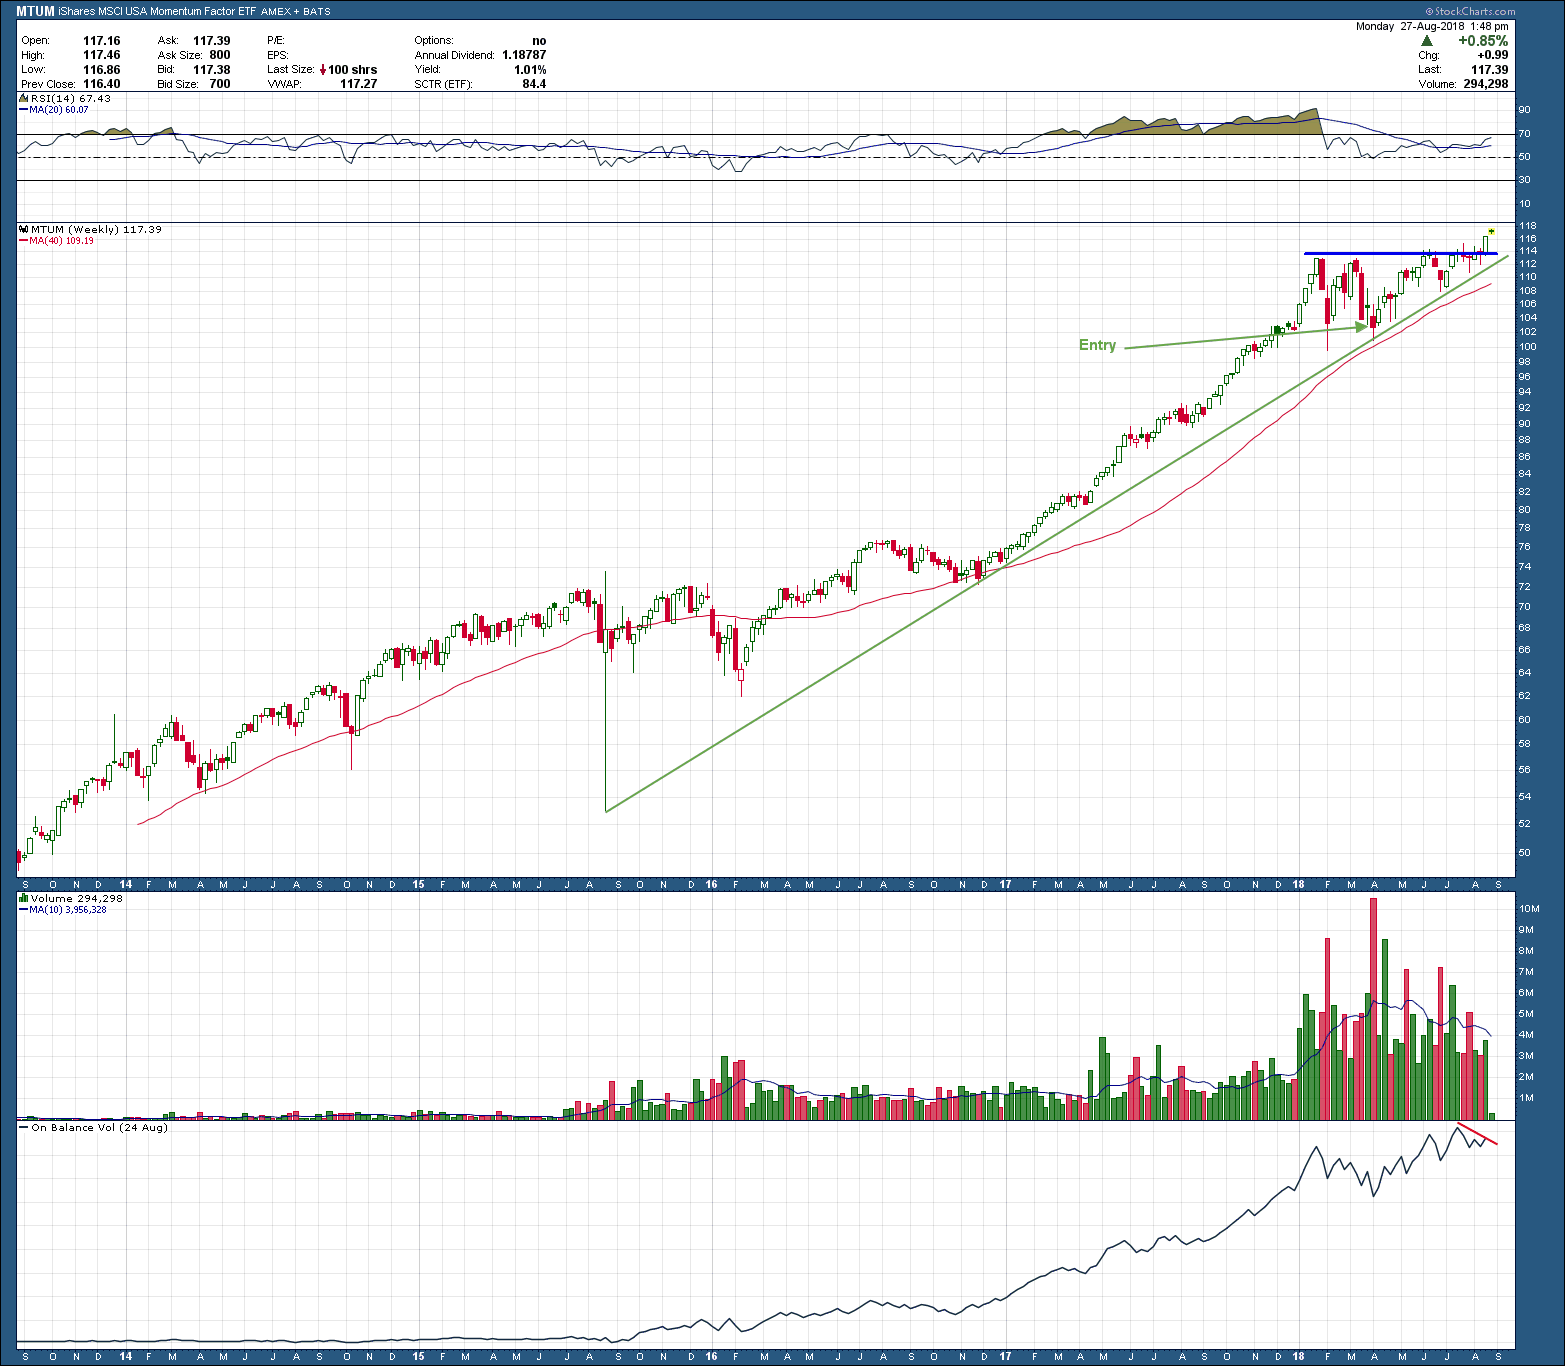
As you can see in the chart below, it recently began trading with enough volume for us to consider adding as a core position to client’s portfolios. I do think our entry in April was excellent as it created a wonderful pullback buying opportunity. As you can see during the consolidation that started in January, RSI momentum unwound out of overbought territory and was set up for its next push higher.  And higher we go as price broke out to new, all-time highs last week. All that is great news for MTUM holders but I just noticed the Referee pulled out the yellow caution flag. Notice how at the same time while price was making all-time highs, on balance volume (lower pane) was making a lower high. It’s not time to throw in the towel just yet as divergence can easily be wiped out and be nothing but memory roadkill if we see an increase in the number of buyers in the coming weeks. So, the bottom line is it’s not a problem …. until it is.

san ramon retirement planning cfp and fiduciary investment advisor - mtum 8-27-18.png

I know some of you are thinking what good is this technical analysis stuff. Every time I show a chart it’s never 100% clear or certain as there is always something both good and bad. Which is exactly why you 1) use a weight of the evidence approach to making an investment decision and 2) have an exit plan in case the market proves you wrong. TA is not about being right but instead about managing your risk.

A Falling Knife or Opportunity of the Year?

Picking bottoms is impossible to do consistently as it means having to catch a preverbial knife.  Plus, bottoms can sometimes take months or longer before they begin to payoff that most investors lose interest, bail and then miss out on the majority of the opportunity. Take a look at the 10 year chart of coffee below. You can see yesterday it touched the $1 area where, in the past (2008 & 2013), its price has found a bottom. Not only did it find a bottom, in both cases it rallied more than 100%. The possibility of capturing even a portion of another 100% return is captivating.

san ramon wealth advisor cfp, and fiduciary investment advisor -coffee - 8-22-18.png

There are a couple of major obstacles that an interested investor will face in this opportunity. The first is how to invest. Going out and buying a pallet of Starbux coffee and hoping to sell it for higher in the future is not a great plan. Coffee is easily tradeable on the futures market if you have a futures account. For those that don’t, there’s an ETN that can be purchased in your brokerage account that attempts to track coffee’s daily price movement, BJO. The downsides of this approach is that BJO is a new issue, it’s relatively thinly traded, an ETN which is subject to contango and a rising dollar.

Still interested even after all that? My next chart should seal the deal. We all know that the commercial specialists are considered the smart money and how they are invested should be paid attention to.  Below is the most recent chart of the CoT data for coffee. As you can see the commercial specialists have the greatest long exposure to coffee that they have for the past 5 years. In fact, if I had presented the 20-year chart instead, the data would not have changed … the smart money is long and long BIG

san ramon wealth advisor cfp, and fiduciary investment advisor -coffee cot - 8-22-18.png

I hate picking bottoms. Not because it’s that difficult but because not every bottom is v-shaped (like 2013). In many cases bottoms are long drawn out (2008) and I get impatient, lose interest and bail on the opportunity. If you are considering taking a position in coffee that is something more than just a morning pick-me-up, your patience could be tested. If you are not the kind of investor that is willing to let opportunities develop, I would suggest you move on and look for another setup. If, on the other hand, the upside potential outweigh your impatience, I think coffee is setting up for one heck of a reversion-to-the-mean profit opportunity.

Biases

San Ramon fee only CFP, independent investment advisor - biases - 8-20-18.jpg

Source: New York Times

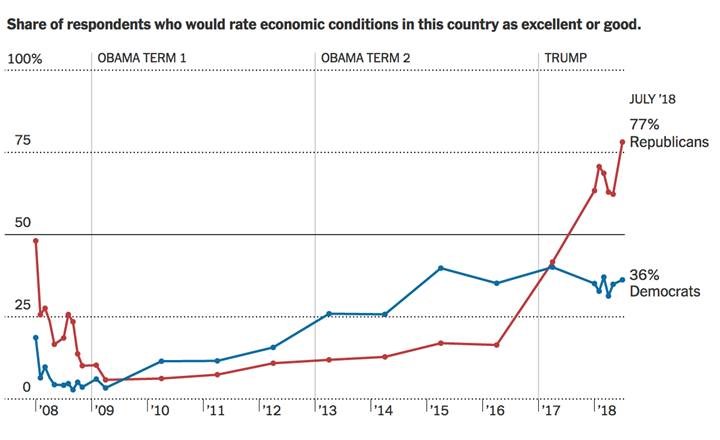
Surprise! Partisan politics confuses some peoples’ ability to make objective assessments of economic data:

“Americans’ perceptions of the economy’s prospects increasingly depend more on their political identity than statistics on output or stock markets. “

Is it a cognitive issue? Of course! Salesmanship? Maybe. Bias? Definitely. But why else would the change in POTUS affect anyone’s impression of the economy improving? Is it more likely forward expectations or tribalism?

Truth be told, it really does not matter.

What does matter is this simple bottom line: your biases affect how you see the world, which in turn affects how you think about, well, everything: politics, money, the economy, and of course, your investments.

You can do your best to not allow these elements into your investing strategies, but if you are human, it is all but inevitable that cognitive errors and biases eventually show up in your portfolios . . .

Blame it on the Millennials

The Millennial's get a bad rap for their adoration of avocados and so it should not be too much of a surprise when you look at the chart of “The First Name in Avocados”, CVGW. As you can see in the longer term view, the stock is up more than 350% over the past 5 years.  This rise has only been interrupted once when it broke its first uptrend line during the 2016-2017 consolidation. While there is negative divergence on RSI momentum, it is still above both its rising 200day moving average and second, long term uptrend. Remember, divergence doesn’t matter … until it does.

bay area CFP fee only investment advisor 8-15-18 CVGW2.png

On a shorter term time frame of the stock below, we see price has broken out above prior resistance and out of a bullish cup and handle continuation pattern. The upside target for this pattern is up around the $113 level. With the breakout occurring on large volume (bottom pane), it helps to confirm and validate the setup. From a risk management standpoint, I see no reason to hold on to the stock if it falls back below the breakout level. As such, with a $15+ reward and $3.5 risk (fall below breakout level), this exceeds our desired >3:1 reward to risk on individual stock opportunities   

san ramon CFP fee only investment advisor. - 8-15-18 CVGW.png

Peter Lynch was the best investor I know of who would watch for areas to invest in based upon strength in certain social behavior. And he had one of the best performance records … ever.  As it turns out in the spirit of Peter, internet memes appear to also be a great place to troll for investment ideas.