Bonds Away

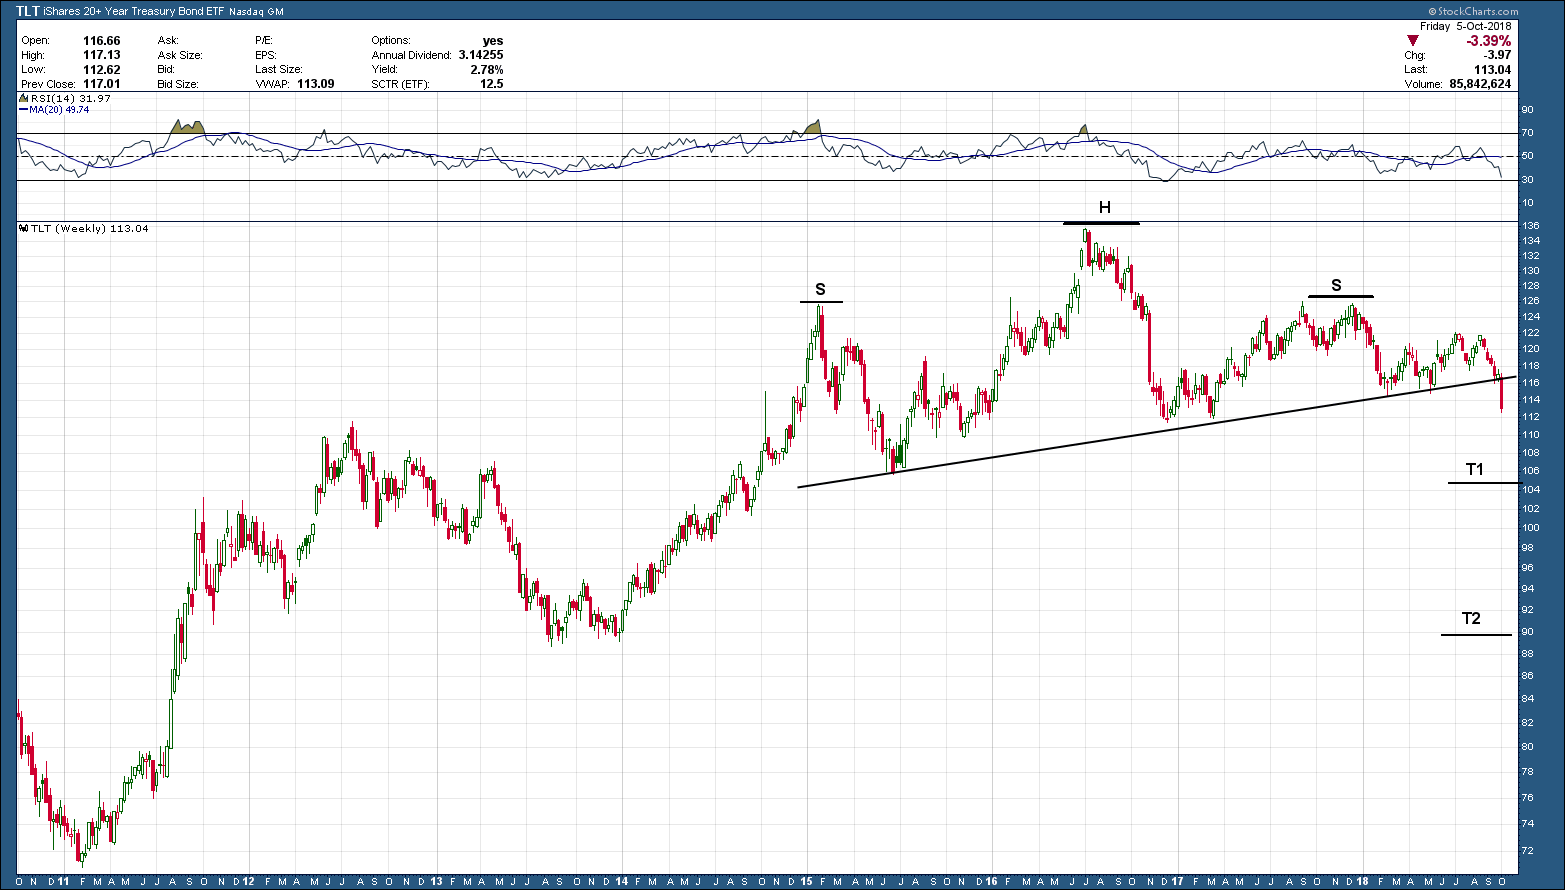
The most important development of the week (and maybe the year) took place in the bond markets. As such, it should come as no surprise that last week’s volatility in stocks was directly related to what was happening to bonds. As we see below in the chart of the 20-year bond ETF, TLT, it started the week right on the neckline (support) of the multi-year head and shoulders topping pattern. As the week progressed, the sell-off in bonds gained steam and eventually closed out firmly below support. Investors under 40 years of age, and possibly even 50 or older (depending upon when they started investing) have never experienced a declining bond market. So, for most a potential bond bear market is uncharted territory.

san ramon napfa fee only financial advisor CFP.png

As you know by now, all patterns are not relevant or meaningful until they have a confirmed close. A confirmed close we have but we need to see the neckline hold as resistance in the coming trading sessions. If so, the 20-year bond has a tough row ahead as the first target is down at T1, and the second is back at 2013’s lows, some 20% below where we started the week.

The table below shows an example of what bond holders across different types of bonds could expect with only a 1% rise in rates and why this potential breakdown is such a big deal. Not every rising rate period is exactly the same so your mileage may vary. What stays constant regardless of the period is the fact the longer the maturity, the greater the expected decline.

bay area napfa fee only financial advisor CFP.png

What’s Cool

It’s interesting to note this year Warren Buffett turns 88 and his fortune (as calculated by Forbes) totals just under $1B for every year he has been on this planet, at $87B. If you dig a bit deeper into Warren “the human” and ignore his mad business skills and wealth, you find he is actually quite a good human being.  He puts money into perspective as you can tell by the top 10 things he thinks are important and, in his words, “cool”.

1.      Saying 'thank you'

2.      Apologizing when wrong

3.      Showing up on time

4.      Being nice to strangers

5.      Listening without interrupting

6.      Admitting you were wrong

7.      Following your dreams

8.      Being a mentor

9.      Learning and using people's names

10.   Holding doors open

Even though I need a lot of work on #5 and #10, I couldn’t agree more Warren, that list is pretty cool.

September 2018 Charts on the Move Video

The bulls were out in force as we closed out the third quarter. With the expected year end rally, 2018 looks to be another strong year for the market…. the US stock market. Bonds, commodities and foreign investments continue to under-perform and act as an anchor to portfolios. Mean reversion will eventually show up but, based upon the charts, Q42018 seems like more of the same.

My Q3 recap video can be viewed in the link below.

https://youtu.be/MgUbcV8Ckb8

Why You Trend Follow

Trend following is a simple concept that has proven itself time and again and across all different markets. In its simplest form, Trend following is a strategy whereby an investor should buy an asset when its price is trending higher and sell when its trend reverses down, in either case expecting price movements to continue. Why this works is because like most things, investments trend.  Of course there is the details to work out as to identify when trends start and end but that is for another post.

When looking at its chart, it’s easy to see why an investor would want to invest in the Russell 1000 stock index (the largest 1000 US stocks). It has been in a clear uptrend since its 2009 bottom, rising more than 420% over the past 9+ years.   

bay area fee only fiduciary certified financial planning investment advisor 1.png

It just so happens that some marketing genius has sliced the same Russell 1000 index into both a “value” and “growth” component thereby providing 3 of the same (but slightly different) flavors of the Russell 1000 index. I have plotted each in the graph below.

san ramon fee only fiduciary certified financial planning investment advisor 1.png

The green line is Russell “Growth”, blue is the entire 1000 stock index and the laggard, red, is “value”. We know historically during strong bull market up-trends there is proven out-performance in owning a larger growth component in a portfolio which is holding true during this uptrend. As the bull market wanes and we get closer to the end an economic up cycle, “value” typically begins to lead “growth”. To put it in perspective, in the case of the Russell, so far “growth” has outperformed the overall index by 70% and “value” by 130% over the same 10 year period. The question an investor needs to answer is why own the broad index or value when Russell growth is leading the trend? Most of the time the answer investors use is because of diversification or they don’t know how to find those that are out-performing. In my mind, those is poor reasoning. Aren’t we investing for one reason and one reason only? To make the most amount of money.

So what we can learn from this very narrow (but representative) look at the US stock market is 1) we are still in a strong bull market 2) trends last longer than one expects (which is why we want to be trend followers) and 3) trend following can provide a clear out-performance advantage over general index investing.

Channeling Charles Dow

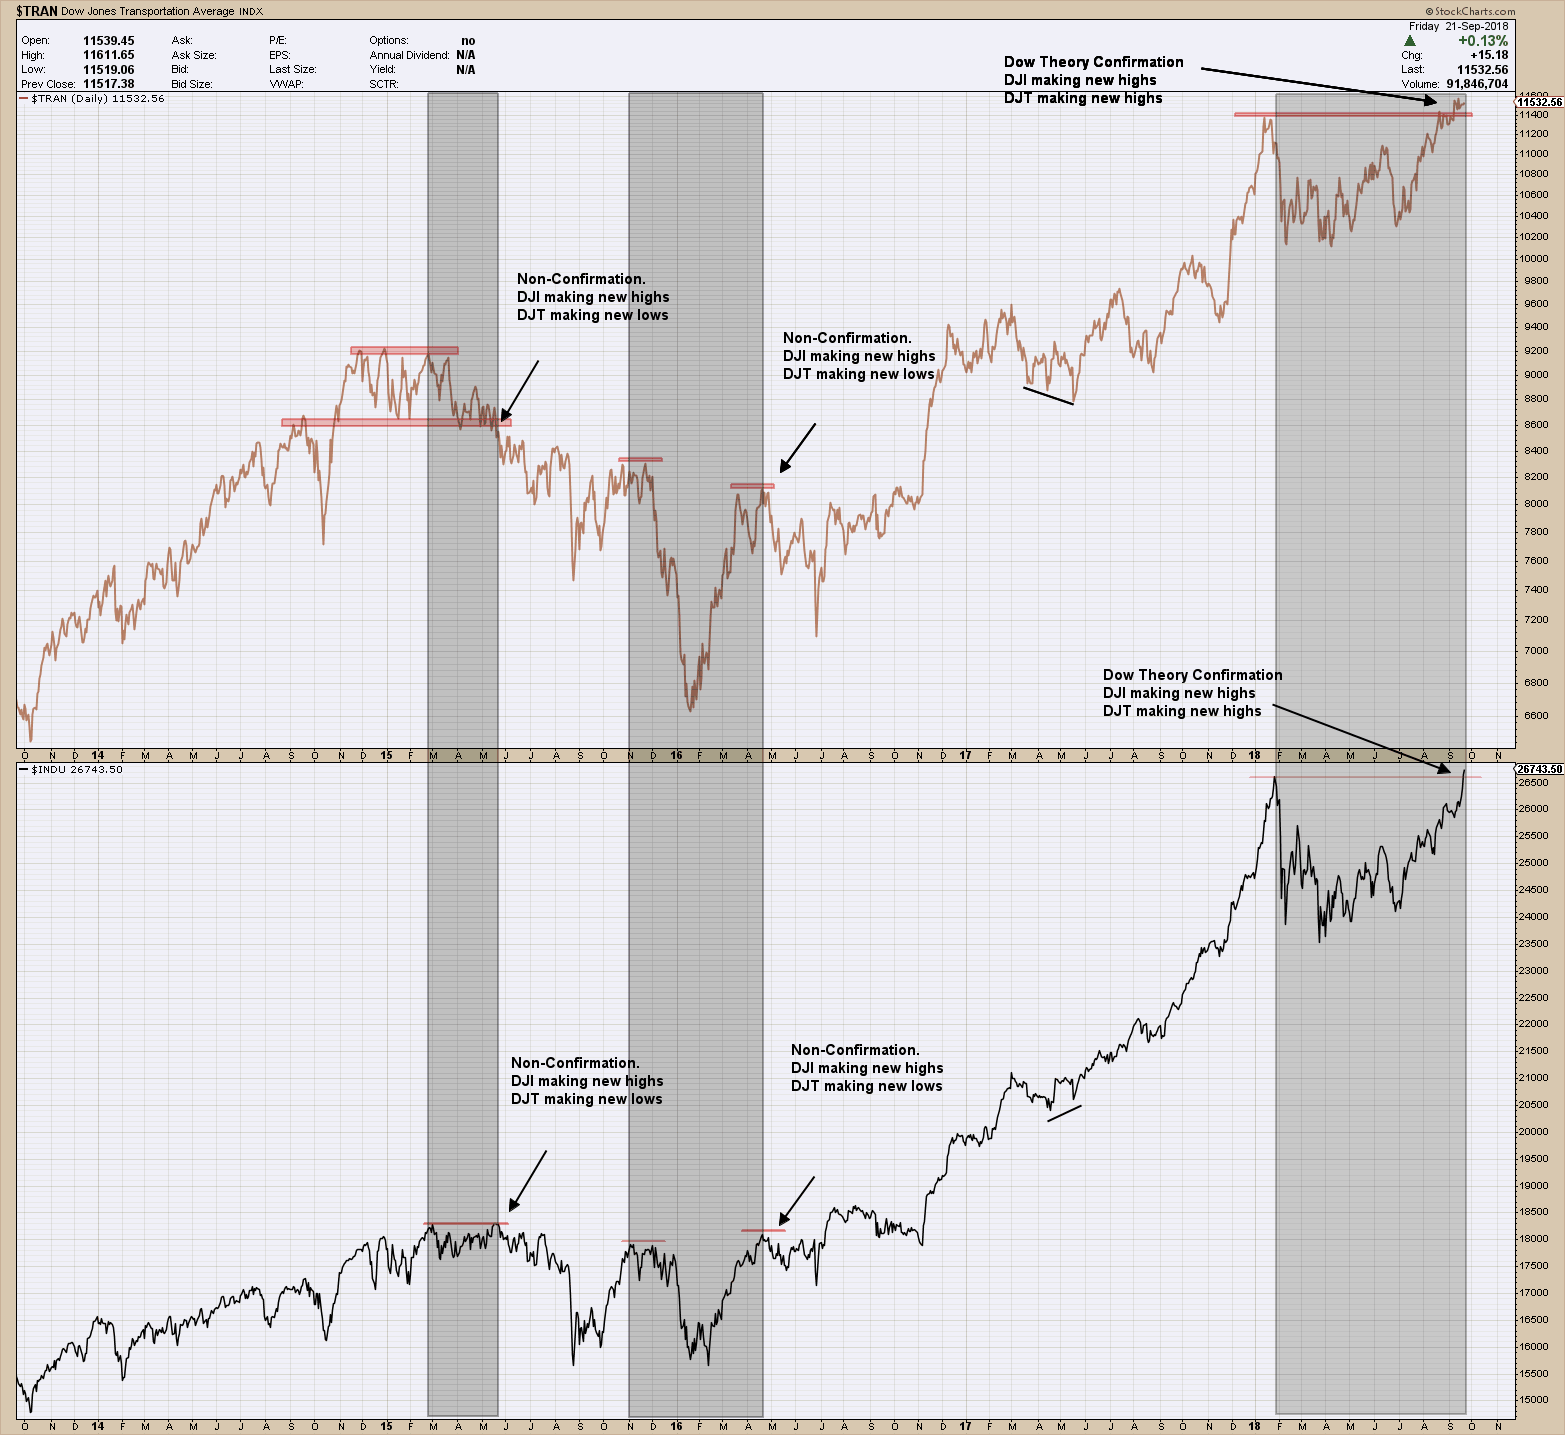
Stock market bulls should be excited as the Dow Theory triggered a buy signal as the lagging industrials finally broke out to new, all-time highs last week.

San Ramon fiduciary financial advisor and certified financial planner CFP - Dow Theory 9-24-18 .png

I’ve talked about the Dow Theory here in past blog posts but for those that didn’t read or want a refresher, you can go here.  Like all timing models, it has periods of either out or under-performance. As such, knowing which period you are entering if you are using as a signal is an unknown. Digging a bit deeper at Dow’s theory and its results, it shows some interesting attributes.

  • The “classical'” Dow Theory under-performed “buy and hold” most of the time. All timing systems, and all Dow Theory “flavors” undergo rough patches. Under performance spells also affect the canonized “classical” Dow Theory.

  • However, in spite of such under performance most of the time, over the long term the classical Dow Theory achieves greater returns with a much lower risk.

  • Interestingly, the Dow Theory under performs when there is no danger out there. In good years for the stock market, the Dow Theory, while remaining solidly positive, returns less than buy and hold.

  • The Dow Theory outperforms buy and hold when it is most needed: When stocks are going down. The average annual performance of the Dow Theory when it is outperforming is a loss of 0.95%. However, buy and hold returned in those years a dismal -16.72% on average.

You may be puzzled to learn that the Dow Theory under-performs when the stock market is in a “good” year (namely when it goes up solidly). However, this has an easy explanation. As with any market-timing system, the Dow Theory never gets us “aboard” at the start of a new bull market. At the risk of oversimplifying we can say that 10% of any new bull market is always lost as the bull market always signal comes after its inception. When the market goes up in an almost straight line, by definition the Dow Theory will lag in returns.

However, what results in under performance in “good” times, is out-performance in “bad” times. When the market heads south and buy and hold gives away all the unrealized gains, the Dow Theory does an excellent job in getting the investor out of the market to avoid most of the decline.

Of course, the best environment for the Dow Theory is a long and sustained bull market where the primary bull market swing lasts more than one year uninterrupted. These are the years when the Dow Theory gets aligned with buy and hold as it remains fully invested along the never-ending primary trend. However, such blissful environment (for both Dow Theorists and buy and hold investors) occurred only 29.4% of the time. Furthermore, if markets were always in such a perfect bullish mood, there would be no need for the Dow Theory or any other market timing system for this matter. Investing would be a piece of cake (Yes, markets actually go down 😊)

As the market tends to have more “good'” years than “bad" years, it is not surprising the Dow Theory under performs most of the time. The take away is Its value lies in out-performing when it is most needed: When the going gets tough.