Investments

Why You Trend Follow

Trend following is a simple concept that has proven itself time and again and across all different markets. In its simplest form, Trend following is a strategy whereby an investor should buy an asset when its price is trending higher and sell when its trend reverses down, in either case expecting price movements to continue. Why this works is because like most things, investments trend.  Of course there is the details to work out as to identify when trends start and end but that is for another post.

When looking at its chart, it’s easy to see why an investor would want to invest in the Russell 1000 stock index (the largest 1000 US stocks). It has been in a clear uptrend since its 2009 bottom, rising more than 420% over the past 9+ years.   

bay area fee only fiduciary certified financial planning investment advisor 1.png

It just so happens that some marketing genius has sliced the same Russell 1000 index into both a “value” and “growth” component thereby providing 3 of the same (but slightly different) flavors of the Russell 1000 index. I have plotted each in the graph below.

san ramon fee only fiduciary certified financial planning investment advisor 1.png

The green line is Russell “Growth”, blue is the entire 1000 stock index and the laggard, red, is “value”. We know historically during strong bull market up-trends there is proven out-performance in owning a larger growth component in a portfolio which is holding true during this uptrend. As the bull market wanes and we get closer to the end an economic up cycle, “value” typically begins to lead “growth”. To put it in perspective, in the case of the Russell, so far “growth” has outperformed the overall index by 70% and “value” by 130% over the same 10 year period. The question an investor needs to answer is why own the broad index or value when Russell growth is leading the trend? Most of the time the answer investors use is because of diversification or they don’t know how to find those that are out-performing. In my mind, those is poor reasoning. Aren’t we investing for one reason and one reason only? To make the most amount of money.

So what we can learn from this very narrow (but representative) look at the US stock market is 1) we are still in a strong bull market 2) trends last longer than one expects (which is why we want to be trend followers) and 3) trend following can provide a clear out-performance advantage over general index investing.

Channeling Charles Dow

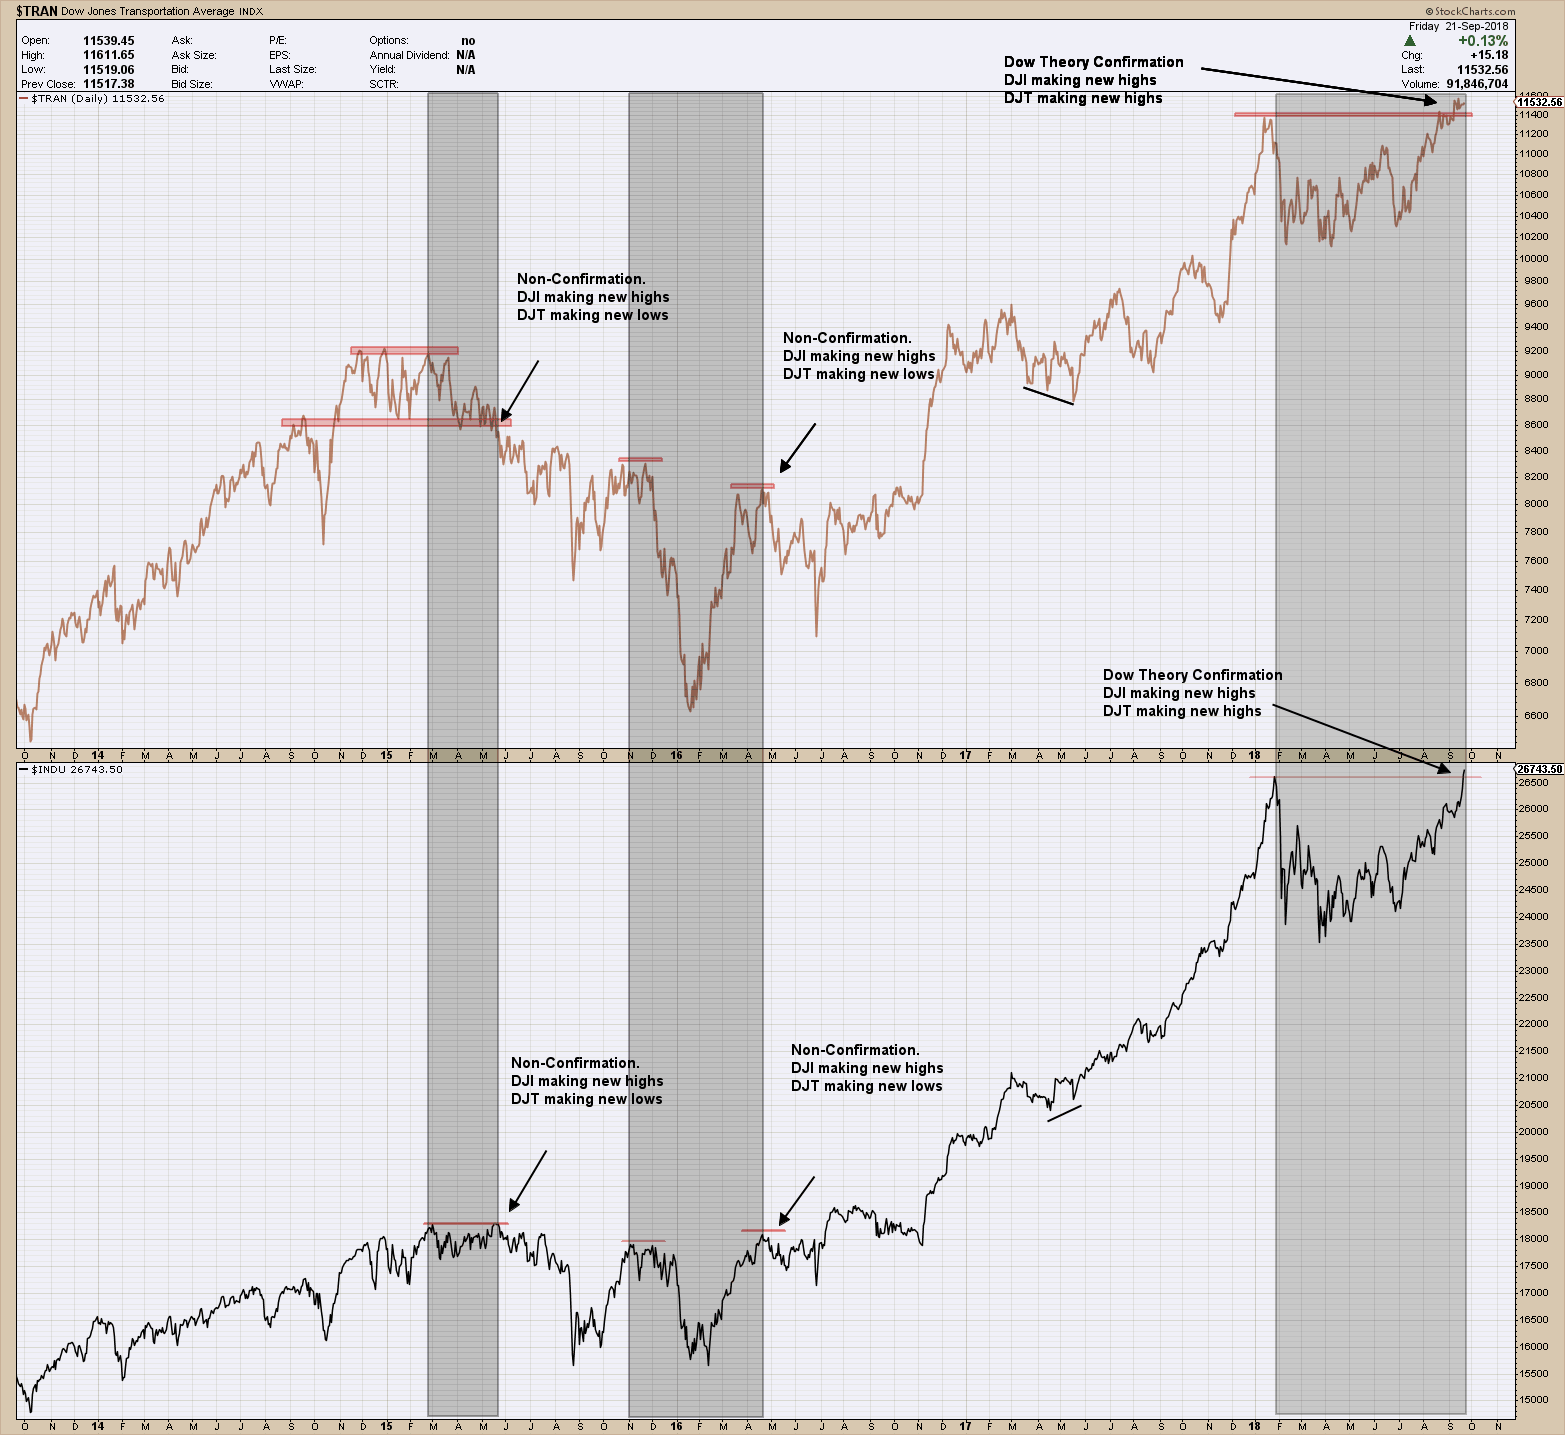
Stock market bulls should be excited as the Dow Theory triggered a buy signal as the lagging industrials finally broke out to new, all-time highs last week.

San Ramon fiduciary financial advisor and certified financial planner CFP - Dow Theory 9-24-18 .png

I’ve talked about the Dow Theory here in past blog posts but for those that didn’t read or want a refresher, you can go here.  Like all timing models, it has periods of either out or under-performance. As such, knowing which period you are entering if you are using as a signal is an unknown. Digging a bit deeper at Dow’s theory and its results, it shows some interesting attributes.

  • The “classical'” Dow Theory under-performed “buy and hold” most of the time. All timing systems, and all Dow Theory “flavors” undergo rough patches. Under performance spells also affect the canonized “classical” Dow Theory.

  • However, in spite of such under performance most of the time, over the long term the classical Dow Theory achieves greater returns with a much lower risk.

  • Interestingly, the Dow Theory under performs when there is no danger out there. In good years for the stock market, the Dow Theory, while remaining solidly positive, returns less than buy and hold.

  • The Dow Theory outperforms buy and hold when it is most needed: When stocks are going down. The average annual performance of the Dow Theory when it is outperforming is a loss of 0.95%. However, buy and hold returned in those years a dismal -16.72% on average.

You may be puzzled to learn that the Dow Theory under-performs when the stock market is in a “good” year (namely when it goes up solidly). However, this has an easy explanation. As with any market-timing system, the Dow Theory never gets us “aboard” at the start of a new bull market. At the risk of oversimplifying we can say that 10% of any new bull market is always lost as the bull market always signal comes after its inception. When the market goes up in an almost straight line, by definition the Dow Theory will lag in returns.

However, what results in under performance in “good” times, is out-performance in “bad” times. When the market heads south and buy and hold gives away all the unrealized gains, the Dow Theory does an excellent job in getting the investor out of the market to avoid most of the decline.

Of course, the best environment for the Dow Theory is a long and sustained bull market where the primary bull market swing lasts more than one year uninterrupted. These are the years when the Dow Theory gets aligned with buy and hold as it remains fully invested along the never-ending primary trend. However, such blissful environment (for both Dow Theorists and buy and hold investors) occurred only 29.4% of the time. Furthermore, if markets were always in such a perfect bullish mood, there would be no need for the Dow Theory or any other market timing system for this matter. Investing would be a piece of cake (Yes, markets actually go down 😊)

As the market tends to have more “good'” years than “bad" years, it is not surprising the Dow Theory under performs most of the time. The take away is Its value lies in out-performing when it is most needed: When the going gets tough.

Rarefied Air

Scouring through 100’s of charts it becomes obvious investors have a clear idea on which companies they expect to benefit from the current political climate. One that immediately jumped out at me can be seen below in the chart of the Aerospace and Defense ETF, ITA. As you can it has broken out to new highs after consolidating for 6 months and using the 200 day moving average as a trampoline to propel higher. With RSI momentum unwinding during the consolidation, it appears to have a lot of room to move higher before investors need concern themselves with being overbought and expecting a pullback

san ramon fiduciary CFP and fee only financial advisor.png

The pattern’s (rectangle) target is still some $12 higher than where we closed yesterday. Keep in mind targets don’t mean a whole lot when stocks have entered rarefied air (new, all-time highs). As such, I expect ITA to likely ignore and blow right through it as long as this bull market has legs.

Muni Bombs

Regular readers should be comfortable knowing investment price patterns develop, repeat and understanding the reasons why. A great example of this can be seen in the US Muni bond ETF, MUB. Over the past 7 years, a head and shoulders topping pattern has formed 4 times. Of the first 3, only two actually played out to or beyond the pattern’s lower target. The middle one failed and reversed strongly higher (“from false breaks come big moves”) where it went on to make pattern #3. Interestingly, all of the first three formed their peak (head) when RSI momentum (the upper pane) entered and then exited the overbought region which is not the case in the current. Muni bond holders want to keep an eye on the present pattern and insure price holds at or above the neckline otherwise risk the possibility of much larger decline.

san ramon fee only napfa fiduciary CFP certified financial planner.png

If you change the time frame on above chart to 5 years instead of 7 thereby removing the first pattern nearest the left edge of the chart and clean it up a bit something interesting appears … a  4+ year head and shoulders topping pattern.  

san francisco bay area fee only napfa fiduciary CFP certified financial planner.png

As you can see, it still has some room before it reaches its neckline and the pattern could trigger. Take a look at volume in the bottom pane. Notice how during the 2015 selloff from the head, you started to see big green bars as it broke below the neckline, an indication the big institutional buyers were stepping in. If I were a Muni bond holder right now I hope to see those big buyers step in once again as/if we approach those same levels. If not, I will be thanking the investment gods above I am not a holder of any Muni bonds as it could just be bombs away lower.

Funnymentals

Bull Market 
noun \ˈbu̇l ˈmär-kət\ 
Random market movements causing investors to mistake themselves as financial geniuses.

In spite of my continual poking fun at anyone putting too much confidence into fundamental only analysis, I do fully admit they should be a part of an investment process.  My problem with them is that they really only become obvious when looking in the rear-view mirror. They are horrible for making decisions on timing because once the information is known, the market has already reacted and it’s too late. In spite of that, I do find them useful and include them in my investment process as one element among many. They are of similar value that longer-term charts are. Directions and trends are more easily discernible and so they help to make short term decisions better but only when used with a weight-of-the-evidence approach. 

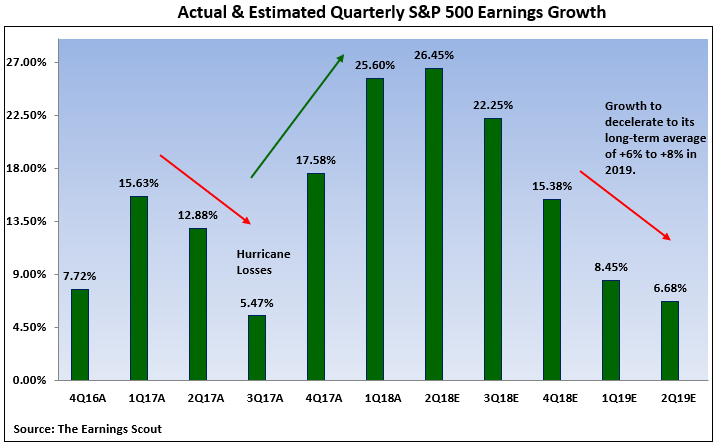
From a fundamental standpoint we know that, in theory, stock prices are directly correlated to corporate earnings growth. Stock prices move higher along with earnings and vice versa, Below is a chart of a 6 quarter look-back and 4 quarter look-ahead of the SP500 indexes earnings growth.

bay areas only fiduciary certifiedd financial planner and investment management wealth advisor.png

For the sake of argument if we take the estimated data at face value (don’t get me started on estimations and the ability to predict the future), the chart is telling us we will see a peak in earnings this quarter (Trump tax and policy changes) followed by a significant rollback to the long-term average. While I do believe the future growth numbers provided will be wrong, I am certain earnings will mean revert lower. Bottom line is the chart is telling an accurate tale. The when, how fast and how much will only be known in the future though. What equity investors need to determine is what impact will earnings mean reversion have on stock prices in the future knowing their strong correlation?